Marketer’s Guide: Making Sense of Qualitative and Quantitative Data
Combine qualitative and quantitative data to fully understand customer behavior and make more informed marketing decisions.
Key Points:
- Know When to Use Each Data Type: Qualitative data provides deep, contextual insights, while quantitative data offers measurable and statistical information. Use qualitative data for exploring new ideas and quantitative data for validating and optimizing strategies.
- Combine Data for Better Insights: Integrating qual and quant data gives a fuller picture of customer behavior, helping marketers make more informed decisions.
- Avoid Common Mistakes: Be cautious of biases, improper data interpretation, and overlooking small patterns in user research.
Your marketing strategy is a house of cards.
One wrong move, and it all comes crashing down. But what if you could see the future and derisk your strategic decisions?
No, we do not suggest adding a tarot card reader to your payroll. (Although that may be more fun than another “Lunch and Learn” session.)
We’re suggesting something far more grounded in reality — mastering qual and quant data.
But beware – this power comes with pitfalls.
At this year’s Experimentation Elite conference, Experimentation Legend Els Aerts, Co-founder of AGConsult exposed the “7 Deadly Sins of User Research” that are sabotaging marketing strategies worldwide:
Episode 124: Seven Deadly Sins of User Research with Els Aerts
- Not thinking business first
- Using the wrong research method
- Biasing your research
- Jumping to conclusions
- Overlooking smaller patterns in surveys
- Laziness (especially when it comes to AI)
- Taking research at face value
Smart marketing mixes people’s stories with hard numbers. This guide shows you how to blend both, dodge common mistakes, and really get what makes your customers tick.
TL&DR: Qualitative data vs quantitative data
| What is it? | Advantages | Disadvantages | When to use it? | Methods of Collection | |||||||||||||||||||||||||
|---|---|---|---|---|---|---|---|---|---|---|---|---|---|---|---|---|---|---|---|---|---|---|---|---|---|---|---|---|---|
| Qualitative Data | Provides in-depth insights and understanding of underlying reasons, opinions, and motivations |
Can be time-consuming and harder to analyze objectively | When exploring new areas of interest or understanding context and motivations | Interviews, focus groups, open-ended surveys, observations, and case studies | |||||||||||||||||||||||||
| Quantitative Data | Provides measurable and quantifiable data that can be statistically analyzed | May miss the context and deeper understanding of the subject | When needing to quantify problems, attitudes, behaviors, or other defined variables | Surveys with closed-ended questions, experiments, and secondary data analysis |
A key difference between quantitative and qualitative approaches is their ROI when analyzing customer behavior for A/B testing.
Quantitative data offers clear ROI: more time invested yields detailed insights, often involving customer segmentation for incremental improvements.
In contrast, qualitative data is less predictable. Watching customer journey videos may confirm known behaviors but can also reveal unexpected workarounds, inspiring disruptive ideas.
Choose qualitative research for disruptive innovation and quantitative analysis for refinement and optimization.
Arthur Moreau, CEO at Datablaze
Unpacking Qualitative Data: Finding Your Customers’ “WHY”
Qual provides a critical layer of insight that numerical data alone cannot offer. It captures the nuanced reasons behind user behaviors, preferences, and decisions, giving marketers and optimizers the context to interpret quantitative findings.
It’s about getting inside your customers’ heads through direct feedback, user testing sessions, heatmaps, and session replays. This approach puts you inside your users’ heads, revealing what they do and why they do it.
MeasuringU, an expert in UX research, explains different types of qualitative research methods.
| Method | Focus | Sample Size | Data Collection | ||||||||||||||||||||
|---|---|---|---|---|---|---|---|---|---|---|---|---|---|---|---|---|---|---|---|---|---|---|---|
| Ethnography | Context or culture | — | Observation & interviews | ||||||||||||||||||||
| Narrative | Individual experience & sequence | 1 to 2 | Stories from individuals & documents | ||||||||||||||||||||
| Phenomenological | People who have experienced a phenomenon | 5 to 25 | Interviews | ||||||||||||||||||||
| Grounded Theory | Develop a theory grounded in field data | 20 to 60 | Interviews, then open and axial coding | ||||||||||||||||||||
| Case Study | Organization, entity, individual, or event | — | Interviews, documents, reports, observations |
When To Use Qualitative Data?
- Define User Personas: Use qualitative data to understand who your customers are and what they need.
- Validate Your Ideas: Got a new idea? Use qualitative research to see if people would buy it. Combine this with quantitative data for better validation.
- Understand Jobs To Be Done (JTBD): To connect with your customers, understand their real problems and goals. Qualitative data reveals why they use your product or service.
- Conduct Market Research: Use qualitative data for initial market research.
When to Gather Qualitative Data
Catch customers when they are more likely to give you an answer. Make it easy for your customer to answer.
- Exit Surveys and On-Site Feedback: Directly ask users for their input during or after specific interactions.
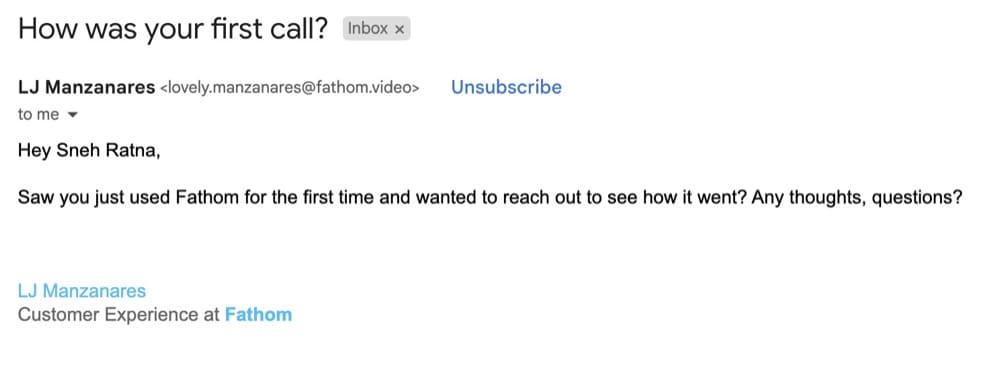
Fathom, an AI notetaker, nails this approach. Right after I used their tool for the first time, they sent this timely email:
- Incentivized Feedback: Offer rewards to encourage participation, ensuring users feel their time is valued. We’ve found a $50 gift card and/or an offer to donate to a user’s favorite charity works pretty well.
Here’s a live example:
- Deep-Dive Questions: Ask about specific actions on your site, emotional reactions, or unresolved frustrations to uncover deep insights.
Wysper, a platform that helps you turn your audio into a content engine, demonstrates a smart approach to gathering qual data.
When I canceled my free trial, Gregory Mayer, the founder, personally reached out:
Decrypting Quantitative Data: The “WHAT”
Quant data provides measurable, numerical insights into user behavior and site performance. It answers the “what” and “how many” questions, revealing patterns and trends that can inform optimization efforts.
Andra Baragan, an experienced CRO specialist and the founder of ONTRACK Digital, shared this in a recent masterclass:
“With quantitative research, you identify the funnels, the key pages, drop-off points, anything you can measure, basically anything you can count.”
TL&DR;
Quant data:
– Can be measured and analyzed statistically
– Provides objective, comparable metrics
– Is often collected through analytics tools, A/B tests, and surveys with closed-ended questions
When to Use Quantitative Data
- Identifying Problem Areas: Use analytics to pinpoint pages with high bounce rates or low conversion rates.
- Measuring Performance: Track KPIs like revenue, conversion rates, and average order value.
- A/B Testing: Compare the performance of different variations to determine which drives better results.
- Segmentation Analysis: Analyze behavior across different user segments to tailor experiences.
- Funnel Analysis: Identify drop-off points in your conversion funnel.
How to Collect Quantitative Data
Step 1: Go beyond the basic metrics on your web analytics tools
- Set up custom dimensions and metrics in Google Analytics to track specific user behaviors relevant to your business.
- Implement enhanced e-commerce tracking to get granular data on product views, add-to-carts, and purchase funnels.
If you’ve been ignoring GA4 like a pop-up ad, this blog post from Mia Umanos, CEO of Clickvoyant, has a guide for marketers who want to know how to use it like an analyst:
- Segments: Used for detailed analysis in the Exploration tab, ideal for analytics experts.
- Audiences: Essential for performance marketers, these can be used in Google Ads for targeted campaigns.
- Comparisons: Useful for quick hypothesis testing within reports to understand user behavior differences.
Step 2: Use a full-funnel A/B testing platform
- Don’t just test page elements. Use tools like Convert Experiences to run full-funnel experiments across multiple pages.
- Implement server-side testing for more complex, personalized experiments that can handle sensitive data.
- Ensure proper sample sizes and test duration for statistical significance.
👋Use our free A/B Testing Significance Calculator
Step 3: Factor in user behavior analytics
- Combine quantitative and qualitative data. Use session recordings alongside heatmaps to understand the ‘why’ behind the clicks.
- Implement scroll depth tracking to understand content engagement.
- Use tools that offer segmentation capabilities to analyze behavior across different user groups.
FYI, We covered heatmaps in another guide, digging into their uses and the top 40 tools. Here’s the gist:
● Holistic View: Heatmaps are great for seeing user behavior, but they work best when combined with analytics and user testing. Bottom line — Use triangulation!
● Tool Features: Look for heatmap tools that collect data automatically, support various devices, and make sharing data easy. They should also protect user privacy and fit into your current analytics setup.
● In-depth Insights: Session recordings and eye-tracking heatmaps can give more in-depth insights, but it’s important to respect privacy and only gather what’s necessary.
Step 4: Conduct on-site surveys and feedback
Use micro-surveys triggered by specific user actions for contextual feedback.
- Implement Net Promoter Score (NPS) surveys at key points in the customer journey.
- Use tools like Hotjar that can tie survey responses to user behavior data.
How to Use Qualitative Data & Quantitative Data
Integrate and analyze qual + quant + behavioral data to uncover deeper insights, validate findings, and drive informed decision-making.
Craig Sullivan, CEO of Optimise or Die and a pioneering voice in experimentation, explains:
Each research method is NOT complete. If you take a photo of a plant or animal, you see only one side of it. Using more than one research method gives you perspective, so you get a 3D rendering of the problem from multiple sides. This way, a problem that looked flat and featureless when you used one method now begins to solidify and take shape as you inspect it from different angles, using different methods. It’s like shining a light on a problem from different directions to get perspective.
- Cross-validate findings: Use quantitative data to verify qualitative insights and vice versa. For example, if user interviews suggest a confusing checkout process, analyze funnel drop-off rates to confirm this issue quantitatively.
- Prioritize improvements: Combine the severity of issues from qualitative feedback with the frequency of occurrence from quantitative data to prioritize which problems to address first.
- Generate and test hypotheses: Use qualitative insights to form hypotheses about user behavior, then design quantitative tests (like A/B tests) to validate these hypotheses at scale. BTW, if you don’t have enough traffic, here’s how you can optimize beyond A/B testing.
Here’s a framework from Ellie Hughes, Head of Consulting at the Eclipse Group, that you can use to make sense of your data:
“I almost think about it as taking a quantitative approach to qual data and a qualitative approach to quant data. Visualize quant data in an easy-to-consume way, and pair qual insights with quant insights that support them.”
P.S. If you already have a hypothesis, find qual and quant data to support your insights.
Here’s another diagrammatic way of looking at how you’d pair quant and qual data:
👋Our in-depth article offers more advice on how to combine qual, quant and heatmaps to build stronger hypotheses.
Here’s a quick look at which data sources optimizers use
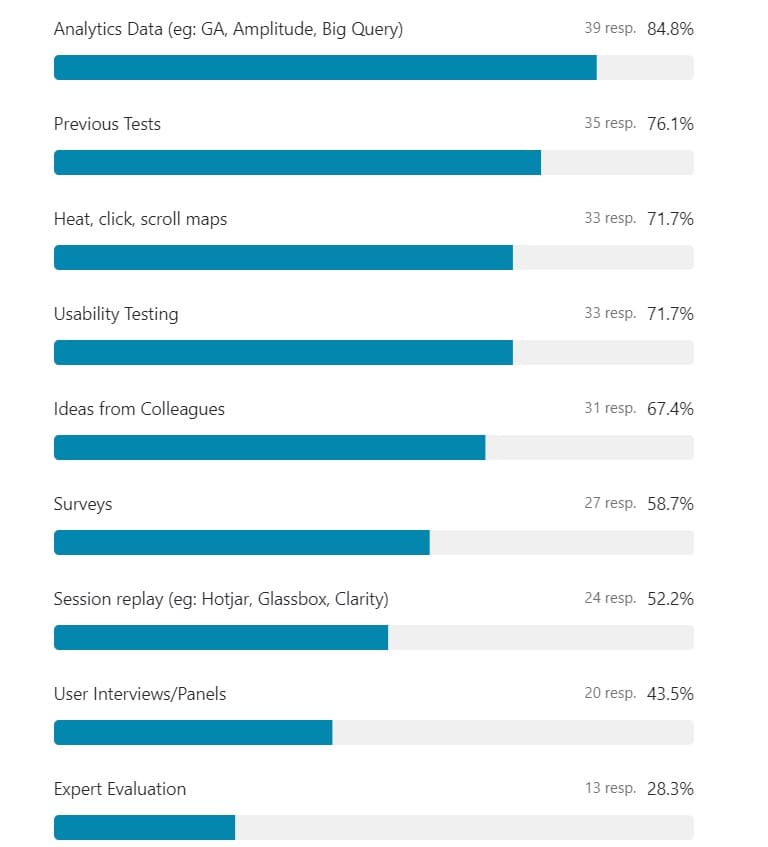
Based on unique data from our Experimentation Elite survey with a total of 155 responses, here’s how optimizers gather data to come up with hypotheses, divided into qualitative and quantitative sources:
Quantitative data sources are widely used by optimizers:
- Analytics Data (e.g., GA, Amplitude, Big Query): 84.8%
- Previous Tests: 76.1%
- Heat, Click, Scroll Maps: 71.7%
- Session Replays (e.g., Hotjar, Glassbox, Clarity): 52.2%
Qualitative data sources are also important:
- Usability Testing: 71.7%
- Ideas from Colleagues: 67.4%
- Surveys: 58.7%
- User Interviews/Panels: 43.5%
- Expert Evaluation: 28.3%
Magic happens when you blend quant and qual data
Combining quantitative and qualitative data leads to better decision-making, higher conversions, and increased ROI in marketing campaigns. Here’s proof:
Mintminds drives a 13% increase in add-to-cart by mixing data sources
Dutch retailer lampenlicht.nl wanted to improve their product pages. They brought in Mintminds, who took a thorough approach to the data. They looked at Google Analytics, observed user behavior on the site, and gathered customer feedback.
Interestingly, their first attempts to improve based on just the numbers led to a drop in sales. But Mintminds didn’t stop there. They combined all their data sources and came up with a new idea: display the product’s key features right on the image carousel.
This simple change made a big difference. Add-to-cart clicks increased by 13%, more people completed their purchases, and the average shopper spent 6.58% more. Repeat customers and mobile shoppers saw even better results, with up to 19% more add-to-cart clicks.
Hilton increases its win rate goes up from 22% to 43%
Here’s how Paula Sappington, Sr. Director, Experience Design Research at Hilton brought qual into experimentation:
- Prioritized UX research: Paula’s team started focusing more on qualitative user research before running A/B tests.
- “Shifting left” strategy: They moved customer feedback and insights to earlier in the process, before quantitative testing.
- De-risking through feedback: By gathering customer opinions on designs and experiences early, they reduced the risk of unsuccessful tests.
- Stronger hypotheses: Customer insights helped them create better test ideas based on real user preferences.
- Customer-driven roadmap: They used feedback to prioritize what to work on, rather than relying on internal assumptions.
- Integrating UX and A/B testing: By bringing these two teams together, they leveraged insights from both areas more effectively.
This practice has increased the win rate from 22% to 43%.
Watch this episode from TLC where Paula dives into the exact stepsTLC: Research & Experimentation-Shifting Left to Win Right with Paula Sappington and Jenni Bruckman (P.S. This video is from 2023 so the win rate mentioned in the video is lower than the current 2024 data)
B2B SaaS company increases sales with research-backed ads
About 6 years ago, Chuck Moxley, CMO of Blue Triangle and co-host of The Frictionless Experience podcast, faced a tough challenge at a tech company.
They weren’t selling as much as they should have, even with a big marketing budget and eight salespeople. Customers just weren’t interested.
Chuck had an idea. He gathered 160 people in four different cities. He showed them what his company’s product could do and asked what they thought.
What he found out was surprising. Chuck says, “People didn’t believe we could do what we said. Our tech seemed too amazing, like magic.”
So, he came up with a bold ad. It said in big letters: “You probably think we’re lying.” Then in smaller letters: “about being able to do X, Y, and Z” – the cool things their product could do.
This honest approach worked great. It made people curious and showed them the product was real. Soon, the company started selling more.
Sometimes, to sell something, you need to understand why people might not believe you first.
The cost of qualitative and quantitative research is high
The primary challenges in combining qualitative and quantitative data are cost and time.
I’ve done true quant studies (e.g., brand awareness) plus focus groups for qual, and both are expensive. It’s been a few years, but it wasn’t unheard of to spend $50K to $70K to do focus groups in 3 or 4 cities and $100K to $150K to do a quant study that included both pre and post measurement, maybe even more (since I might be recalling only the pre-cost)
Chuck Moxley, CMO of Blue Triangle
Traditional methods such as focus groups and quantitative studies can be prohibitively expensive, ranging from $50,000 to $150,000 or more, and can take several months to complete.
But there are affordable tools that make it possible to collect qual + quant data:
- Platforms like Wynter offer access to existing panels, significantly reducing recruitment costs and time.
- With video conferencing, remote qualitative studies are possible, eliminating travel expenses and venue rentals.
- Convert allows running enterprise-grade experiences at self-service prices, making advanced testing more accessible. We offer a 15-day free trial (no credit card required)
These tools democratize access to valuable market insights for companies of all sizes.
At Convert, we make it possible for you to set up every kind of experiment. We know that one size doesn’t fit all so let you decide when and where to run experiments.
See why Convert won the Whole Market AB Testing Tool of the Year!
Written By
Baptiste Debever

Edited By
Carmen Apostu

Refreshed By
Sneh Ratna Choudhary


