6 Actionable Google Analytics Tips to Win the Sales Game in 2021
If there’s a right time to start doing advanced analytics, it’s now. Due to the COVID-19 pandemic, customer behavior has shifted, and now you may have no idea what you need to do to convince customers to stay.
Here are 6 tips that will help you get back on top of things.
Analyze Page Visits
Your traffic may be back up from the fall at the beginning of the pandemic, but it may not convert as much as you may want it to. Analyze page visits to see how user behavior has changed during the lockdown. You can find information on page views in the Content Overview > View Report.
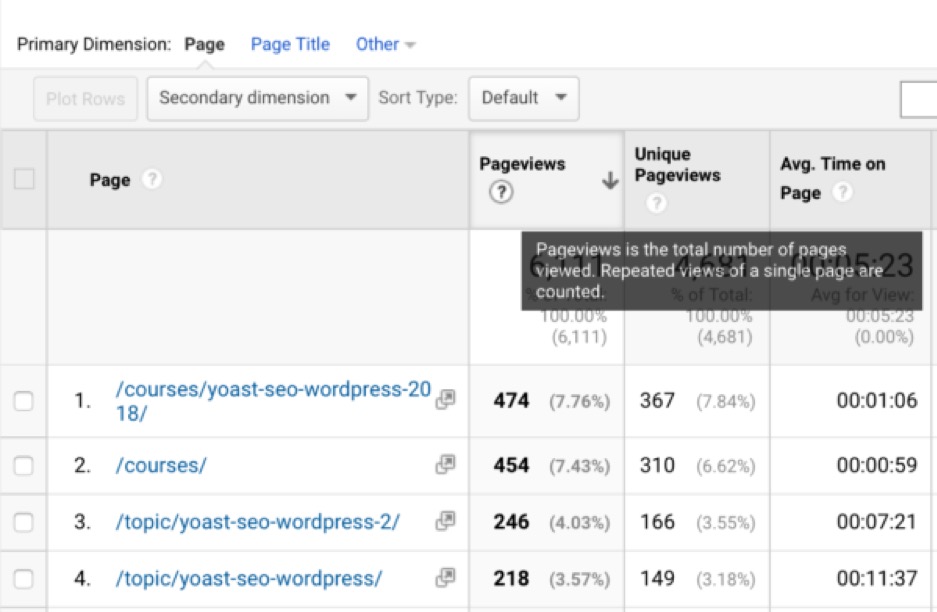
However, just looking at what your most performing pages are isn’t enough. See historical data, and you may find that your customers stopped visiting the pages that used to convert well and are more interested in your blog or free tools.
If that’s the case, you may see the same traffic numbers, but far fewer conversions. Alternatively, you may see no difference in page attendance at all. This would be a signal that your business is doing just fine on lockdown.
To get a quick look into what pages perform best, go to Behavior > Site Content and find top pages by pageviews in the report. You don’t necessarily need to explore the best-performing pages, though. All you need is a look at how much pageviews do different pages gain now as opposed to before the lockdown.
You can fine-tune the comparison of different time periods by expanding the calendar option and checking off the “Compare to” box. Set any date there, and compare the results.

Takeaway
Use a custom page visits report to compare how page visits changed with time. If you do find that customers’ interests in certain pages have shifted, it’s a signal for you to change your approach to site content. Especially so if the visits that are going down are highly converting ones.
You will need to work out the reason for this change with other tools like customer surveys or analysis. For instance, you may find that the reason is one of your marketing channels failing.
Track Changes in Behavior Flow
The Behavior Flow report can show you how customers behave before making a purchase or converting to any other goal. Tracking this metric is a good idea in and of itself, but it becomes even more important when customer behavior may shift such as during the lockdown.
This report can show you the flow between pages, events, or content groupings that precede the purchase. You can also set it up to show both pages and events. If you go with this option, the report will show everything clients do before reaching the set goal: visiting pages or groups of pages, making downloads, watching videos, etc.
This, for instance, allows checking for events like page visibility. This graph shows that some users opened the website’s “About us” page and left to see another open tab, never returning. Check the statistics above the graph to see how many people left on the second interaction.
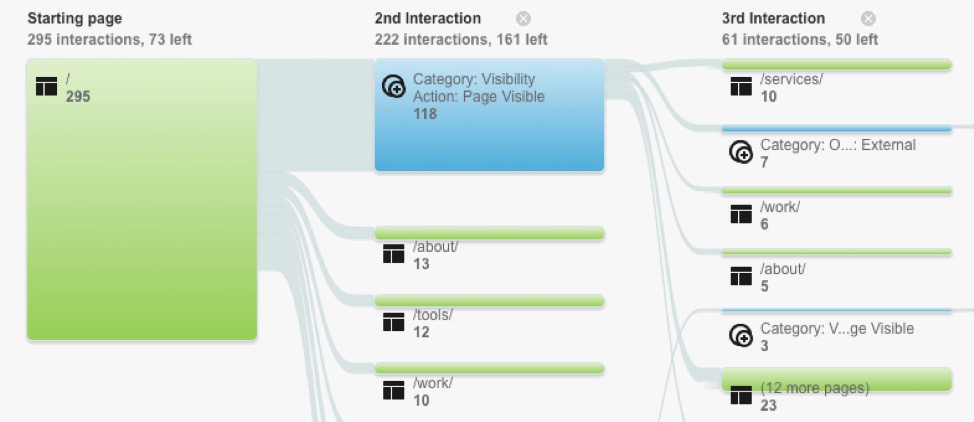
Content groupings can be valuable as well, but you have to set them up in advance. This setting shows groups of pages and events that you’ve grouped by tracking code, extraction rule, or tag manager. This doesn’t work retroactively, so Google Analytics will only start tracking these groupings after you’ve established them.
You can even group pages automatically by choosing the corresponding mode of presentation. This includes how do they get on the website, what pages they view, what elements of the website they interact with.
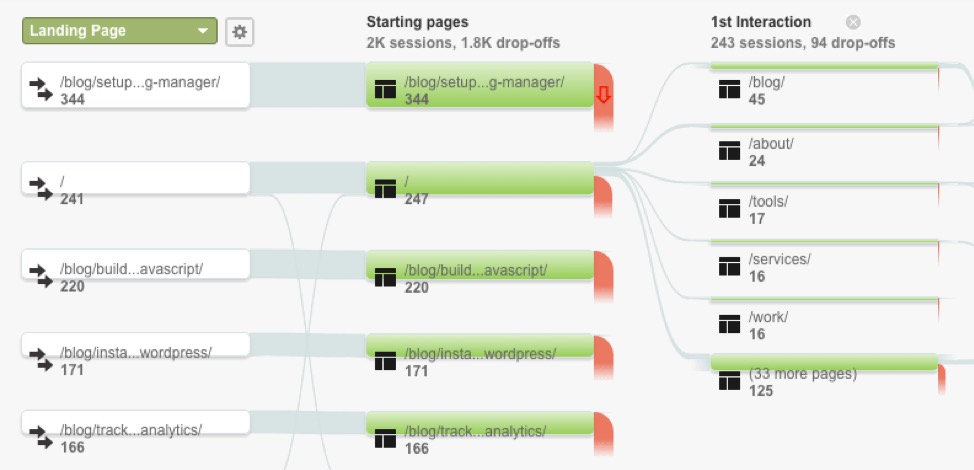
This information is invaluable for optimizing the website internally. You’ll be able to see whether your sales funnel works as intended and make appropriate adjustments.
Takeaway
Use the Behavior Flow report to understand how users navigate your website. You can even study when users leave certain pages or events by looking at exits on the chart.
This is especially handy if you’re using customer journey mapping. A customer journey map is a visualization of the path a customer takes from the moment they learn about your brand to the purchase.
Find out how users navigate your website, look for weak points where a lot of users exit the website, and experiment to increase conversion rate.
Reverse Engineering the Customer Path
If you need a glance on the customer path that precedes any specific goal, try the Reverse Goal Path report. It’s located under Conversions > Goals.
Set any location like the pricing page or the thank-you page that pops up after contacting your company, and this report will show you several pages that precede this page on the customer path. You can also include metrics to understand the path better.
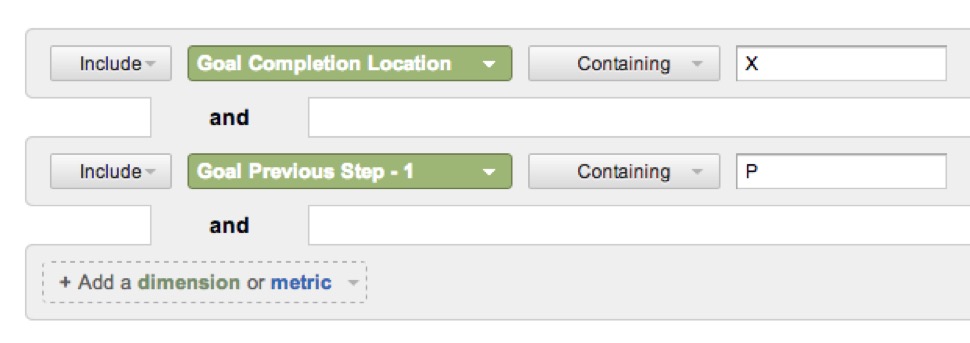
The result is a table that includes the steps and metrics that you included in the report.
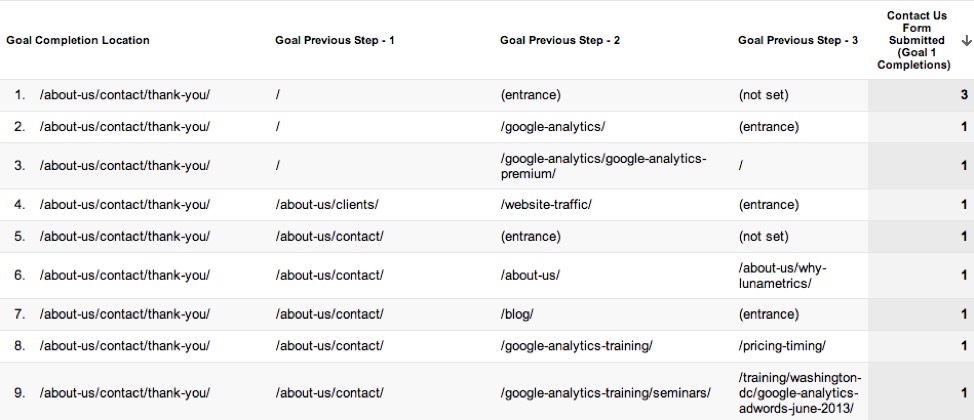
This helps you get a general idea of what people are doing on your website before making an action like ending up on a page or submitting a contact form. Tracking what people were looking for before visiting the FAQ page may also be a great use of this report.
Takeaway
Reverse engineering a path is a good addition to the customer journey mapping efforts from the previous tip. Use it to see all the paths that users take before they reach a goal on your website. This may help you find pages that convert fewer people but still contribute to conversions. Focus on improving that page with CTAs or internal linking.
It only shows you the results of successful interactions so it can’t fully substitute Behavior Flow or Goal Flow. However, it can give you quick insights on any customer path on your website.
Attribution Reports
Are you doing multichannel marketing? You need to use the Google Analytics Attribution feature to learn more about what channels perform best.
Now, this feature is still in beta testing so its functions may be limited for the time being, but what we have already is quite impressive. Set it up by connecting a website and conversion types, and in some time you will have the full report.

It takes a month to gather the data, but the wait is worth it. The Attribution report will give you insight into what marketing efforts actually lead to conversions.
It analyzes ad clicks with AI and works across channels to give you a clear picture of how well your marketing works. When you finally receive the report, you’ll be able to adjust your upper funnel marketing strategy.
Assisted Conversions metric is by far the most useful one. It shows you what channels provide the most leads.
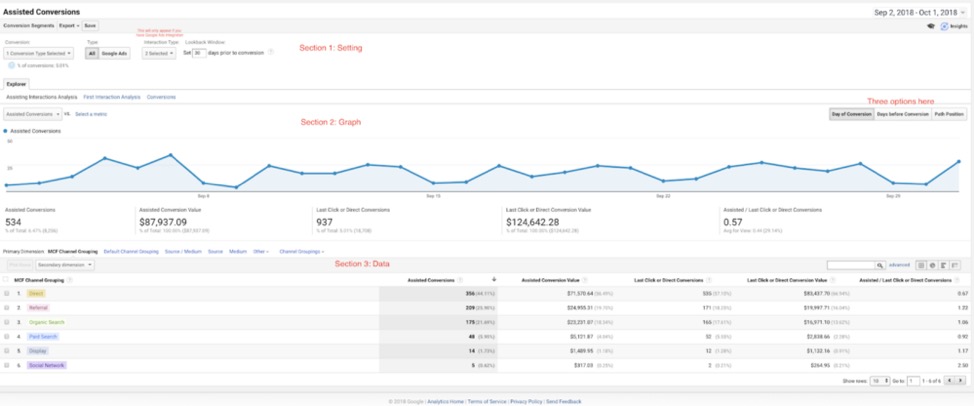
If that may be deceiving, check the Assisted Conversion Value table as well. It shows the total value of these conversions. It may be the case that one channel brings in a small number of high-paying clients. In that case, you may want to focus on developing that channel instead of focusing on the one that just produces a lot of conversions.

Takeaway
Use the Assisted Conversion feature to find what marketing channels perform best in terms of conversion and revenue. Use this information to alter your marketing strategy. If you find that a channel that you planned to be a major revenue stream underperforms, improve the way you handle it, or focus on the one that performs best.
You can also use this data to improve your vision of the upper-funnel part of the customer journey map.
Measure Returning Visitors
In times of crisis, having loyal customers is extremely important. Apart from working to retain your current clients, you can do one more thing. Run the new vs returning visitors report to see how much of your website users go back to the website.
You can find it in the Behavior > New vs Returning tab. The report gives you a comparison of the most important metrics that include revenue.

While not all of them are current clients, having returning readers of your blog or users of your tools is essential for building a client base further. During a time when attracting new visitors may be more difficult than ever before, your returning visitors are an invaluable asset.
They already like your content and it may be easier to engage with your marketing down the sales funnel.
Takeaway
Use the returning visitors report to check how well your website succeeds in holding people’s interest. In the long term, this should improve the lifetime value and overall revenue of the company.
If the ratio of new vs returning visitors is too small or the share of returning visitors started dwindling after lockdown, it’s a sign that you should improve user retention efforts.
Set Up Custom Alerts
The situation with the lockdown spiraled out of control pretty quickly. Before you knew it, thousands of websites had a drop in traffic. If you want to be able to react quickly to dire situations before they become too difficult to deal with, you need to set up alerts.
Custom Alerts that can be found in the Customization folder will give you all the knowledge you need in real-time. You can set up any alert you want and the system will notify you when the criteria for the alert are met.
The possibilities for setting up an alert are virtually endless, but there are some good metrics to track when it comes to responding to changing customer behavior quickly.
For starters, track sudden changes in all metrics that were discussed previously in this article. Spotting a sudden drop in returning visitors, or a shift in behavior flow may go a long way.
Also, you should set up alarms to inform you when traffic, organic or paid, drops below a certain level or changes in comparison with the previous day.

Takeaway
Use custom alerts to monitor changes in all the metrics mentioned previously as well as others. If you’re creating a new marketing strategy to help your business bounce back after the lockdown, you also may want to set up alerts that trigger when certain campaign goals are met.
Add alerts that notify when these goals aren’t met in the expected timeline, and you’re all set to fine-tune a new strategy as soon as possible.
Did you know you can seamlessly import Google Analytics goals & revenue or send back Custom Variables and Dimensions all with one click? Convert Experiences integrates with Google Analytics so you can create and track goals and start counting conversions right away.
Try it out free from 15 days.
Conclusion
The COVID-19 pandemic may have changed customer behavior, but your business can still stay relevant if you know exactly what is going on. Use these tips to analyze how user behavior changes as the world slowly exits the lockdown.
This will give you the footing needed to bounce back.
Written By
Haley Osborne

Edited By
Carmen Apostu

