How to Wrap Your Head Around Minimum Detectable Effect (MDE)
The Minimum Detectable Effect (MDE) is the smallest true effect an A/B test can detect with sufficient statistical power, factoring in test duration, sample size and practical significance.
- There’s a big tradeoff between MDE and test duration. If your MDE is too high, you risk missing real improvements, but if it’s too low, the test might take an impractical amount of time to complete.
- When choosing an MDE, a good rule of thumb is to aim for around 5%, but that could go down to 1-2% for high traffic sites, or up to 10% for lower traffic ones.
- The goal is to target the lowest MDE you can hit within a 2-8 week timeframe.
What Is MDE?
Minimum detectable effect (MDE) is pretty simple on the surface, but it’s also one of the most confusing and misunderstood terms in online A/B testing.
💡 The most common misunderstanding is that the MDE is the smallest lift in an A/B test that will be statistically significant. People with a pretty good understanding of these things might think, “How is that a misunderstanding? That’s what MDE is!”
Well, it’s pretty close, but even those people know in the back of their minds that statistical power also factors into MDE.
Assuming 80% power, we would have to extend that definition to be “the smallest lift that will be stat sig 80% of the time”.
This is where the common understanding starts to fall apart.
If you’ve played around with significance calculators, you’ll know that any particular set of numbers, consisting of user and conversion counts for control vs variant, will always give you the same significance as a result. So how can it possibly make sense to talk about a set of numbers being significant 80% of the time? Where does the uncertainty come from?
The answer is that the MDE is about the true effect, whereas the result you get from the test is the observed effect.
To understand this nuance, we need to back up and review what we’re actually doing when we run an A/B test using frequentist statistics.
We’re setting up two competing hypotheses: one that the variant is better than the control, and one that it isn’t – there is no difference or the variant is worse.
(Note: For simplicity, we’re using one-tailed tests in this article, which is also what you should use in almost all A/B testing scenarios, but that’s a topic for another time).
The one where the variant is no better than the control is the null hypothesis, which is what we default to unless we have enough evidence to reject it. The one where the variant is better is the alternative hypothesis.
Both of those hypotheses are about the actual state of the world, and in order to figure out which one might be true, we need to gather a slice of data to provide evidence one way or another.
This idea makes more sense if you think about it in the context of a pharmaceutical trial where the researchers need to use a small group of people to figure out how a particular drug will work for the entire population.
It’s the same idea with a website A/B test; we want to run the test for a relatively short period of time, often on a smaller subset of our users, in order to make a decision about whether to roll out the variant to everyone, everywhere, forever.
Okay, I’m being a bit dramatic here, but the point is that we need to make a decision based on limited information that will affect things at a larger scale. And we need to make this decision knowing that if we took the same-sized slice of data at different times, we would get slightly different results because we are dealing with the intersection of technology and human psychology which is not particularly consistent or predictable.
Hopefully, now you’re starting to see how this all works together. We’re designing a test to understand the true difference between control and variant based on a slice of data.
This is where the MDE comes in.
It’s the answer to the question: “If the variant is actually better, and we want, at minimum, an 80% chance of confirming that with our test, how much better does the variant need to be?”
This point is important, so I’ll repeat it: MDE relates to the (unknown) true difference between control and variant, whereas reaching stat sig or not relates to the (known) observed difference in the experiment.
Now that we have the basics out of the way, we can move on to the more thorny question of how to go about choosing an MDE for an experiment, and what it even means to “choose” an MDE.
How to Use MDE in Pre-Test Planning
There are two ways you can use the concept of MDE in your test planning:
- The first one is the more “correct” approach in the sense that it aligns with the actual definition of MDE.
This is where you enter all of your test parameters, including significance, power, and planned sample size, and then calculate what the MDE would be for your test. This is a bit of a roundabout way to plan a test since it’s pretty unusual to decide the sample size arbitrarily. To make it work in practice, it would be an iterative process of picking a runtime or sample size, seeing what the MDE would be, adjusting the sample size up or down, calculating the MDE again, etc.
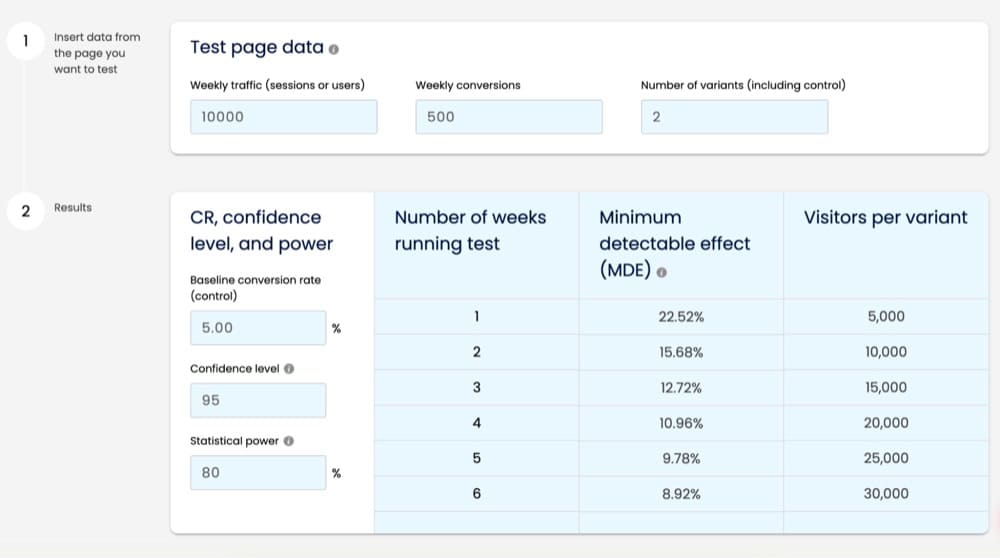
There are tools that make this process a bit easier, like the Pre-Test Analysis tab in the Speero AB Test Calculator. This lets you enter your weekly traffic and conversions and test parameters, and then tells you what the MDE would be if you ran the test for between 1 and 6 weeks. I’d personally like the option to extend this out to 8 or even 12 weeks, but it’s pretty helpful as is to see what ballpark you’re in.
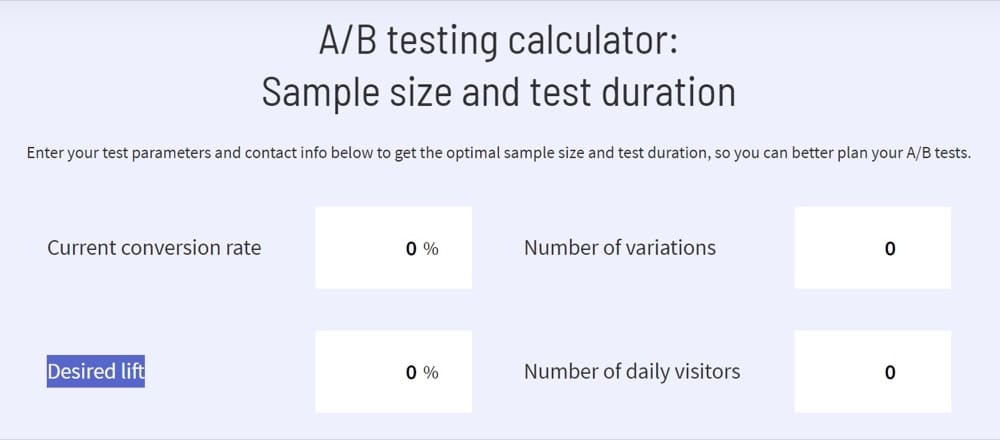
- A more common and straightforward approach is to use MDE as an input, along with the other test parameters, to calculate the sample size needed for the test. Combined with the actual traffic on the page being tested, this will tell you how long the test needs to run. There are tons of these sample size calculators out there, and unfortunately a lot of them create another source of confusion: they ask you to enter an estimated or desired lift:
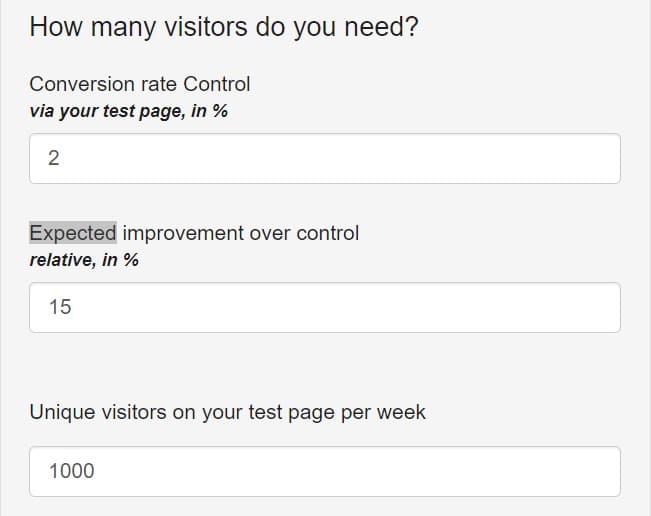
Naturally, this leads people to think that they need to estimate in advance how big of an observed effect the test will have, which makes no sense when you think about it.
Wouldn’t the desired effect be as large as possible? And if you could accurately estimate the effect size, why would you need to run the test at all?
But even if you could predict the effect, planning the test based on it is not at all the purpose of doing a sample size calculation. Remember what we learned about MDE relating to the true effect rather than the observed effect?
What we’re doing here is designing a test procedure that will detect a true effect of a certain size, at least 80% of the time, if it exists.
The right way to think about this is to plan the test based on the smallest true effect that is of interest to you considering the business context, which is sometimes called practical significance.
The correct term for this is Minimum Effect of Interest, or MEI. But since we already have more acronyms than we know what to do with, I just call it the target MDE.
You might be wondering, why do we need to have a minimum effect at all? Don’t we want to be able to detect any improvement, no matter how small it is?
Why Do We Even Need a Minimum Effect?
Let’s use a concrete example: Say you have an e-commerce site with 10,000 visitors per week and a purchase conversion rate of 5%. We’ll stick with the typical defaults of 95% confidence, 80% power, and use a one-tailed superiority test.
Now, let’s say you want to be able to detect a fairly small improvement, like say a 1% increase in the conversion rate. If you plug all those numbers into a sample size calculator, it will tell you that you need almost 5 million total visitors in the test, which will take almost 10 years:
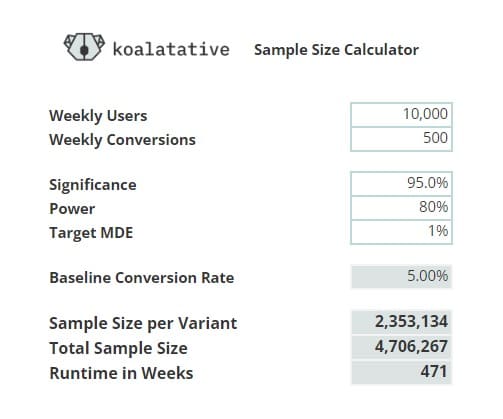
I don’t know about you, but I’m not aware of any businesses that can wait for 10 years to make a decision about which version of the checkout to go with.
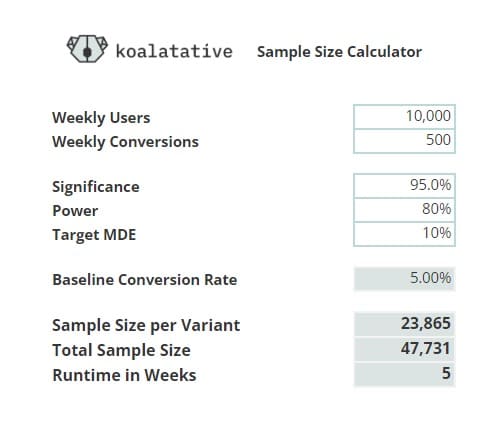
So let’s see how the same scenario looks if we only want to detect a 10% effect rather than 1%. In this case, you’d need less than 50,000 total visitors, which will only take 5 weeks:
As you can see, there’s a pretty huge tradeoff between MDE and test duration.
If your MDE is too low, it will take way too long to run the test. But if your MDE is too high, you risk missing a lot of real improvements. If your MDE is 10%, then the variant could actually be 5% better than control but the test will still be inconclusive. All that work of doing conversion research, coming up with the test idea, getting it designed and developed, and running the test will be wasted, even though the treatment could add a lot to the bottom line.
So as annoying as it is to wrap your head around all this statistical mumbo jumbo, the success of your testing program depends a lot on getting this stuff right.
The good news is that practical significance and scale move together rather nicely.
- If you’re Amazon, then a 1% improvement means millions in extra revenue, and you also have enough volume to be able to detect a 1% effect in a short amount of time. It’s also pretty hard to get larger effect sizes on a site that’s been thoroughly optimized for many years.
- If you’re a startup, then a 1% improvement might not move the needle very much, so there’s not much reason to design your tests to detect small effects like that when it would take too long to collect the data anyway. And on a site that hasn’t been optimized, it’s not unrealistic to see tests win by 10% or more.
That said, if your calculations tell you that you’re going to need an MDE of 20% and up, then that’s likely a sign that it’s too soon to start A/B testing. Even considering MEI and practical significance, it can be pretty demoralizing to the team to have a lot of inconclusive tests, so it might be better to wait until you have enough traffic to run lower MDE tests within a month or two.
There are ways to run faster experiments while keeping the stats valid, but they’re a bit beyond the scope of this article.
How to Choose an MDE for a Test
As you can see, many factors go into choosing an appropriate MDE for your experiments.
There’s practical significance, how much it would cost to implement a winning variant, how long you’d need to run the test to achieve that MDE, how likely you are to get wins that exceed your MDE by a healthy margin, and how comfortable you are with the risk of missing true effects (false negatives) and of implementing changes that aren’t actually better than the original (false positives).
But typically, the approach should be to target the lowest MDE you can hit within 2-8 weeks.
The duration is going to vary by testing location. For example, if a sitewide test takes 2 weeks, then testing on a single product page might take 2 months.
For most projects, I aim for an MDE around 5%, but that could go down to 1-2% for high traffic sites, or up to 10% for lower traffic ones.
I highly recommend doing a testing bandwidth calculation at the start of a new program.
This process involves calculating your test durations for all of the pages or groups of pages/templates where you may want to test. It will give you a good overview of what your testing landscape looks like and can help you prioritize your efforts.
This way, you won’t waste time coming up with test ideas for pages where it’ll take 6 months to complete a test.
Comparing MDE to Observed Effect
Once you’ve chosen an MDE, and used it to plan and run a test, now what?
Let’s say you’ve tuned your experimentation machine to detect a 5% true effect. Here are a couple possible scenarios:
- The observed effect from the test is 1%, or
- The observed effect from the test is 10%
The good news is that there’s actually no need to compare the MDE to the observed effect at all.
In both of those scenarios, all that matters is whether you’ve reached your planned sample size, and whether the result is statistically significant. Of course, the second scenario is far more likely to be stat sig than the first one, but the whole point of doing some work to plan a test properly up front is that it makes things much more straightforward on the post-analysis end. So just run the final numbers through a calculator that tells you the p-value and/or significance, and if it meets your threshold (for example a p-value of 0.05 or significance of 95%), you have a winner.
If you want to go deeper on this question of comparing MDE to the observed effect, Georgi Georgiev has just published a thorough article on the topic that explains it with lots of detail and graphs.
Final Thoughts
Hopefully, this helps you get a better understanding of the concept of MDE and how you can use it in practice to plan and run better experiments.
My goal with articles like this is to make these concepts accessible for the average experimenter while leaving out the overly academic details that make your eyes glaze over and your brain shut down. Not everyone needs to be a data scientist to run experiments, but if you can put a bit of time into learning about how some of these statistical parameters work together, you can avoid a lot of the traps that make stakeholders question the quality and integrity of your test results.


Written By
Ryan Thomas

Edited By
Carmen Apostu
