Core Web Vitals for A/B Testing: Is Your A/B Testing Software Slowing Down Your Site?
Google just dropped their Core Web Vitals update and we need to pay attention to it.
Why care?
As CROs, we don’t normally worry about the traffic side too much, as we’re focused on what happens when people land on our sites and the actions they take.
The thing is, this new update is focused on user experience so not only is it relevant to us as optimizers, but there’s a chance that your testing might actually negatively impact your site’s Page Experience scores and traffic.
Not great, right?
In this article, I’m going to walk you through what this update is, how it works, how your testing might affect it, some best practices to not only reduce the impact of this new SEO update but also how to actually improve your scores and maybe eke out some more organic traffic because of it.
Will My A/B Testing Tool Slow My Site And Affect My Core Web Vitals Score?
Let’s get this out of the way right up top. The Convert app is incredibly fast and shouldn’t negatively affect your Page Experience or Core Web Vitals score, as long as you follow best practices for both testing and CWV setup.
Not every site follows best practices, however, and in those situations, your A/B testing could affect your Page Load speed, First Input Delay, Cumulative Layout Shift, or Largest Contentful Paint, depending on how you have your test and site set up.
The good news?
Each of these elements is easily fixable. We’re going to cover all of this as we walk through this guide, along with how to improve your baseline Page Experience and CWV scores and not break them when testing.
What Is the Difference between Core Web Vitals and Google Page Experience?
What Is the Google Page Experience?
Page Experience is 1 of 200+ ranking factors that Google uses to help them identify and rank their search results.
The Page Experience algorithm is a group of metrics and results that Google is implementing to understand and improve how its users experience a web page. Their goal is to provide their users with the best content and the best user experience.
What Are the Core Web Vitals?
Core Web Vitals are metrics set up inside of Google’s Page Experience algorithm that are designed to measure or simulate actual user experience and are the focus of their latest update.
The three Core Web Vitals are:
● Largest Contentful Paint
● First Input Delay, and
● Cumulative layout Shift.
They seem complicated and have fancy names, but they basically break down to tracking key moments in a user’s Page Experience:
- How fast does your page load?
- How quickly can the user see the main elements on the page and understand what it’s about?
- How soon can they interact with the page?
- How long till that interaction works from clicking a button to the action taking place?
- How does the page look and is it easy to use?
Why do we care?
We care because Google cares and it’s one of the VERY rare occurrences where they have pointed out a specific ranking factor, how it works, and how to improve on it. When this happens, it’s worth paying attention as it’s a sign of things to come.
Why Does Google Care About User Experience?
Simply put, if they are recommending results that provide a bad experience or an incorrect result, then there’s a chance their users might start to move to their competitors.
Page Experience isn’t considered a major ranking factor yet. Google recently stated that all things being equal between you and a competitor, Page Experience will more likely act as the deciding factor that will determine who ranks higher, simply because you’re providing the best experience, but it’s not the only factor.
(Great content, offer, E.A.T, and backlinks will always move the needle the most.)
However… Google does seem to be making big moves towards User Experience becoming a major search ranking factor in the future. They changed their entire ranking index results to be focused on mobile-first experience and results.
This means that while Page Experience is a mobile-focused algorithm because their entire index is now mobile-first, this affects all website owners out there and how they show up in desktop results.
You might have a great piece of content on desktop but it’s the mobile version, not the desktop version, that will affect where you rank in the results. Not only that, but Google also cares about the page’s loading speed and layout. They’ve updated and raised the bar on what’s needed multiple times, setting a standard for loading time and more, all to improve mobile searches.
I said this before, but it’s better to get an idea for this now and start to implement best practices, especially because User Experience can directly affect our CRO campaigns and your testing tool might also affect those SEO results…
So let’s break each of these Page Experience metrics down, your current results, what each metric means, and how you can meet their requirements, along with some things to keep in mind so that your testing won’t negatively impact your score.
How To Measure Your Current Core Web Vitals and Page Experience Results
You can technically use Google Search Console for this, but I feel like the data can be a little vague or limited. (Results are listed as “poor”, “needs improvement”, or “good”.)
Instead, head on over to Google’s PageSpeed Insights tool and check out your site there.
The Insights tool is really easy to use. Simply input the URL of the page that you want to check, let it run, and then look at your results for both mobile and desktop.
Don’t just check your homepage here. Your homepage is usually fast to load and lightweight and so it will often give the highest score of all of your pages. (Each page on your site has its unique score, based on many factors that we will cover soon.)
Instead, I recommend you check out a page that’s either resource intensive such as a blog post, a long-form sales page, or even the page that you want to run a CRO test on next, as this will give you a more accurate representation of how your page performs.
Your goal is to get a score of 90 or above for mobile AND desktop.
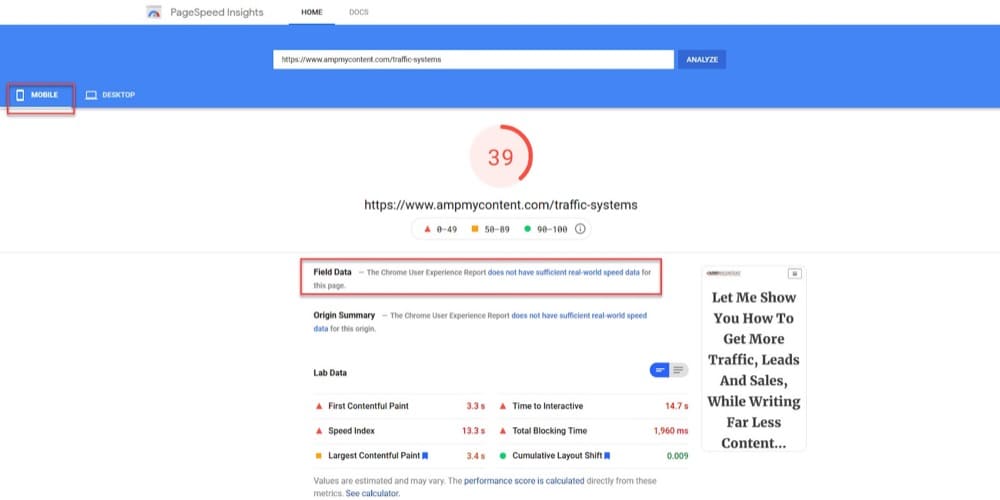
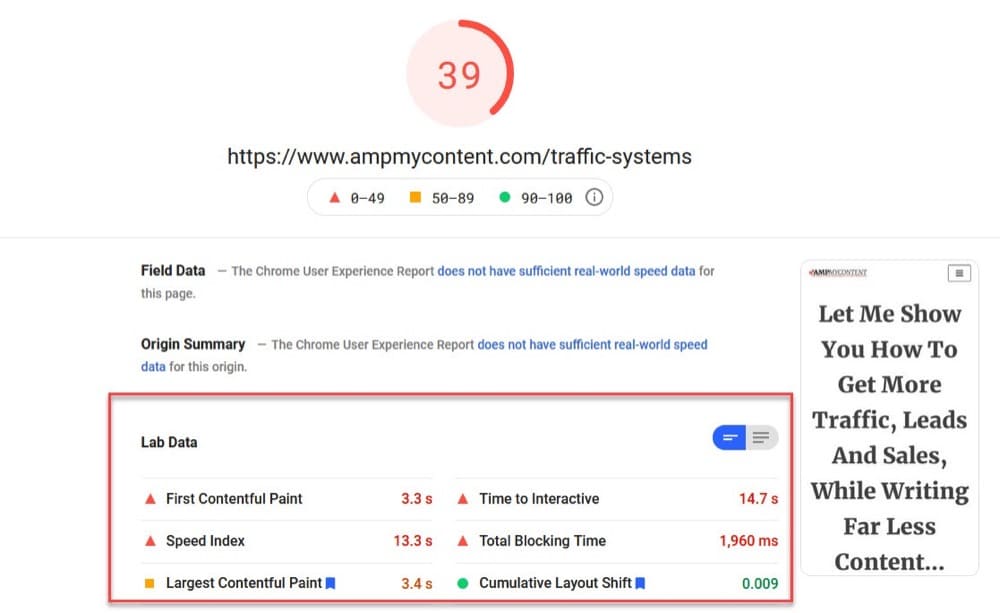
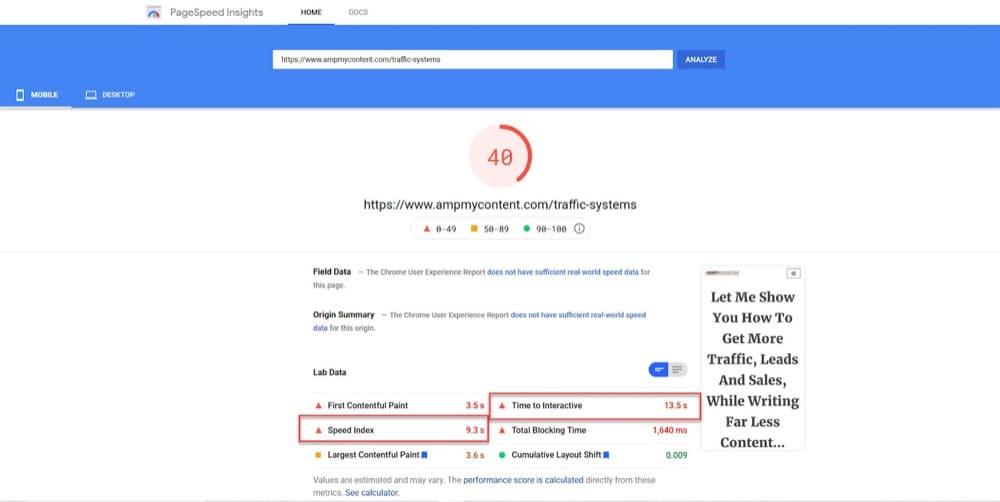
Clearly, this page needs work as it takes 14.7 seconds before mobile users can interact with this page fully!
Now, there’s a reason why this page takes so long to load on mobile. It’s around 11,000 words, with 30 or so images and 3 videos on it.
That’s a BIG page!
During this article, I’m going to continue to improve this sales page as we work through each Core Web Vitals report recommendation, so you can see the difference in its page speed and score.
Then, once I’ve updated the site and page to meet Page Experience and Core Web Vitals, I will show how setting up A/B tests on this page might affect my results.
- Anything in red needs work asap.
- Anything in yellow can be improved.
- And anything in green currently meets requirements.
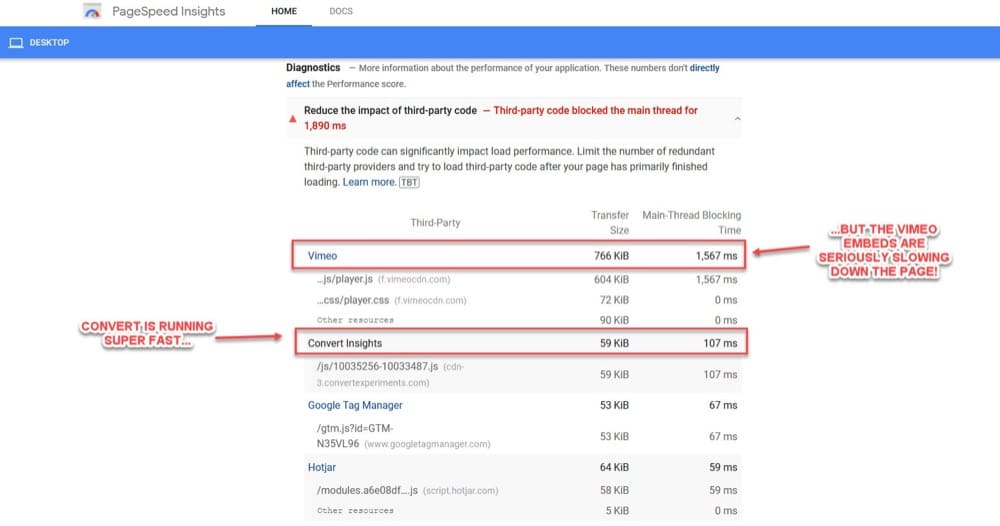
An interesting thing to see is that the Convert Experiences app is only slowing down my page by 107 milliseconds in the background, while the Vimeo app is causing a 1,567 milliseconds delay.
This is not their app’s fault, but instead, it’s due to me needing to fix a bunch of issues with my page and my website that are causing it to not function properly.
Before I can improve these issues though, we need to understand what they mean and how the tool gave this result…
How Does The PageSpeed Insights Tool Come Up With These Results?
The PageSpeed Insights tool uses Google’s Lighthouse dev testing tool to get an idea of how your page performs.
Lighthouse applies specific weighting metrics based on your page performance to come up with this score.
These weightings are based on the most important user experience factors and often change to reflect when Google adds new features to track UX. (Again, this is why this seems to be an important thing to focus on today).
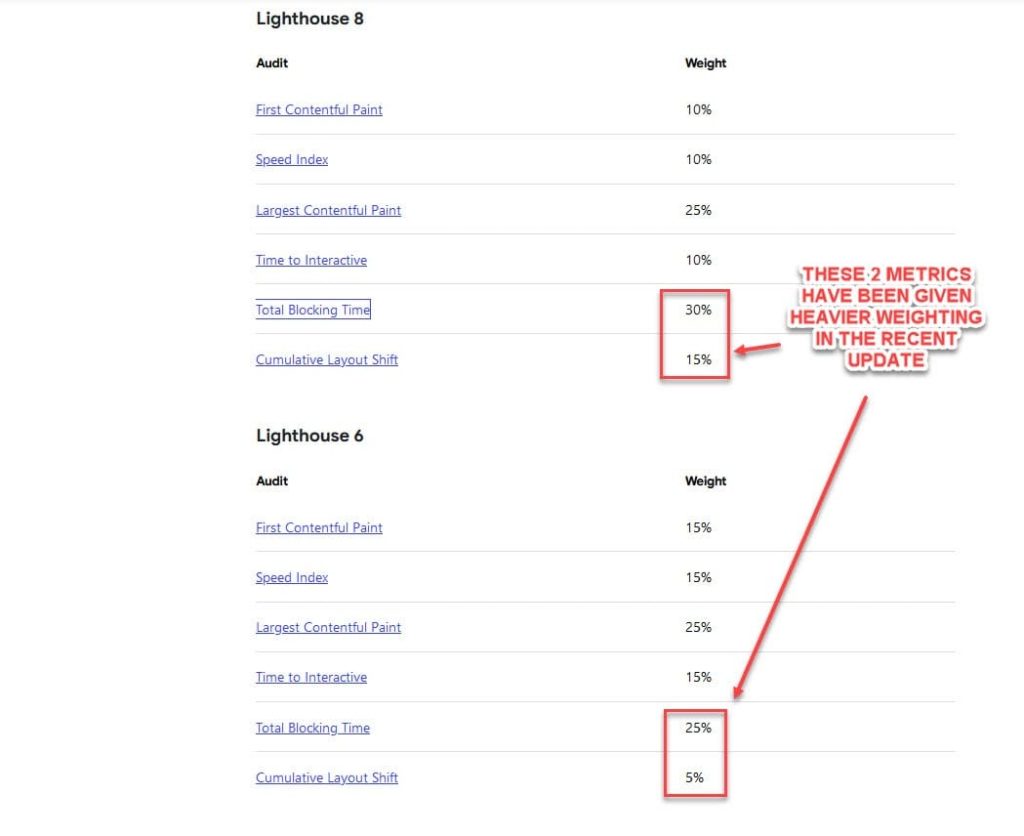
If we compare the last version of these weightings to the newest version of Lighthouse, we can see that Cumulative Layout Shift and Total Blocking Time have been given a much heavier weighting in their importance compared to previous versions.
Does this mean the other elements are suddenly less important?
Not at all. In fact, they have probably been given less weighting as more sites are updated and meet the standard Page Experience requirements.
It seems that the focus now has been shifted towards stopping pages from having changing layouts as the page loads and reducing the time it takes for the page to respond to user input.
These are both important things that we need to consider as testers because our test might cause the page to load slower or the layout may shift when we test new layout designs.
The Lighthouse tool takes those weightings and then applies them to your current page using something called Lab and Field data to measure your page’s performance.
What Is Lab and Field Data?
Lab Data is basically a simulation of specific conditions to create a control environment. It’s what the majority of users reading this article will use to test and improve their page.
Whereas Field Data is based on real user experience on that specific page, but it’s a little flawed. You need a lot of live traffic to that page to get results. Not only that, but this traffic has to have come from Chrome users who have also opted into the (CrUX) Chrome User Experience Report, which not everyone uses or opts in for.
The user score in-field data is based on the 75th Percentile of users’ experience on that page.
Why does this matter? Because each user’s experience can vary depending on their device and internet speed.
If 26% of your audience is browsing on an iPhone 5 with a slow connection, then your score could drop down to 74% and it would show that your page ‘needs improvement’.
Finally, the Field Data is based on a 28-day rolling aggregate so the reports are based on previous results. Changes today won’t be reflected in the results for another month.
As you can see, Field Data won’t be relevant to all of us. The good news is that the Lab Data from the Insights tool is good enough and gives us enough information to see how our changes and updates affect that simulated environment, so we can get a rough idea of how our site may perform out in the wild.
So now we know our baseline results on our worst performing/most important pages, we can learn what all these metrics mean and how to improve them.
What Are Google’s Page Experience Metrics, the Three Core Web Vitals Metrics, And How Can We Improve Them?
There are 4 basic Page Experience metrics and 3 more in a specific subset called Core Web Vitals (the focus of the latest Google update).
Learn what Google qualifies as a great user experience & read more about the 4 basic Page Experience metrics.
Each of these basic metrics is quite easy to achieve. All you need is a responsive site, no dodgy code, not to cover the site in popups, and to be running through HTTPS.
These are just the basic elements though. There are 6 more Page Experience metrics used by Lighthouse when it measures your Page Experience performance using Lab data.
Now although there are 6 Lab metrics to focus on, they are all interconnected. This means an improvement in one usually sees an improvement in others.
To help simplify all this, Google has broken these down into 3 Core Web Vitals:
- Largest Contentful Paint
- First Input Delay, and
- Cumulative Layout Shift
These are where we need to improve and it’s also where our tests may affect our rankings.
Let’s work through each of these Core Web Vitals below and what you need to do to improve them, before looking at how your tests might affect these scores.
1. Largest Contentful Paint (LCP)
Largest Contentful Paint is based on the loading speed of the largest visible element on your screen. This could be a hero shot, a background image, or even the headline text.
This score is designed to replicate how long it takes for your audience to start to see the main content on your page and get an idea of what the page is about.
Currently, LCP is weighed at 25% of your CWV score.
Your readers being able to understand your page is important to fix, but it’s more than that. You see, most issues that cause a slow LCP are usually the root causes of what slows down pages and causes other CWV issues. This means that if you fix these LCP elements then you have done the bulk of the work.
Your goal should be to get your LCP to load in under 2.5 seconds.
The main issues that lower your LCP score/speed are:
- Slow server response times
- Render-blocking JavaScript and CSS, causing element delays
- Slow resource load times
- Slow client-side rendering
- Poor/Incorrectly set image optimization.
How To Improve Your LCP Score
There are several things that you can implement to improve your LCP score.
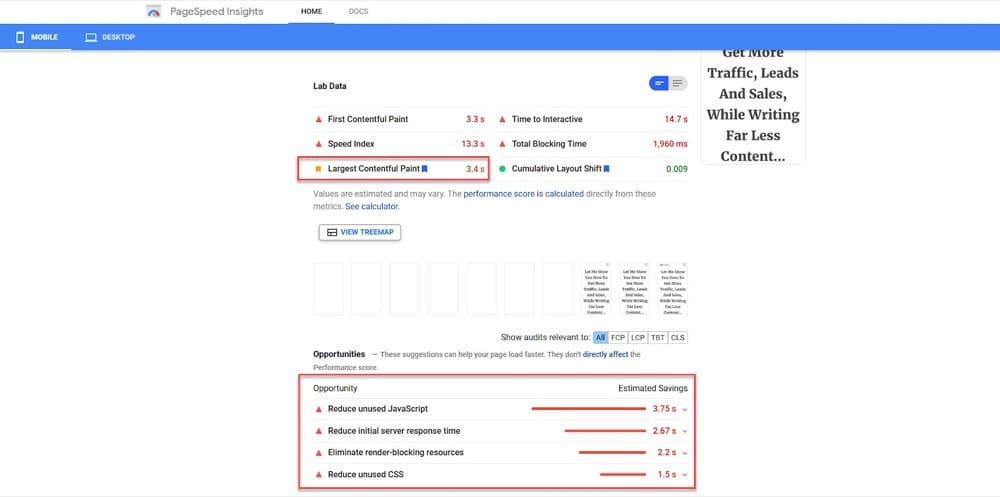
Here you can see my example sales page LCP score before I make any of the recommended tweaks.
It currently takes 3.4 seconds for my LCP element to load on the page, even though it’s just a headline of text, and my page takes 14.7 seconds to load before it becomes interactive.
If we scroll down through the PageSpeed Insights tool and look at the opportunities, there are a bunch of things I can do to improve the overall page speed and stop some of the things that are slowing the LCP down.
Let’s go through all of them.
a. Preload The LCP Element
The first thing you need to do is check what the actual LCP element is for your current page, as it can vary between pages.
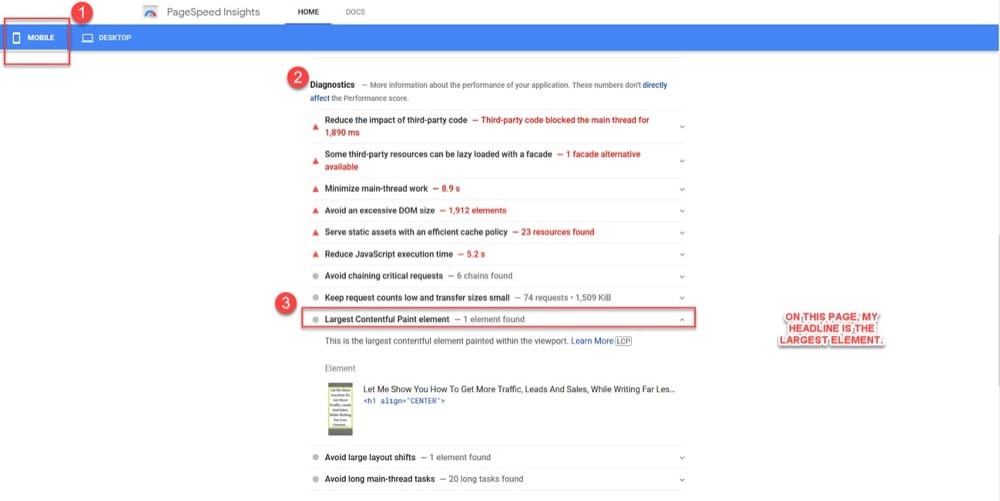
While on the mobile view of the PageSpeed tool, scroll down the page to the diagnostic section and click on the ‘Largest Contentful Paint’ element and see what comes up.
On this particular page, my LCP element is my headline.
I can improve the load speed of my text by sorting out other things on my page such as compression and caching, but what if my LCP element was an image?
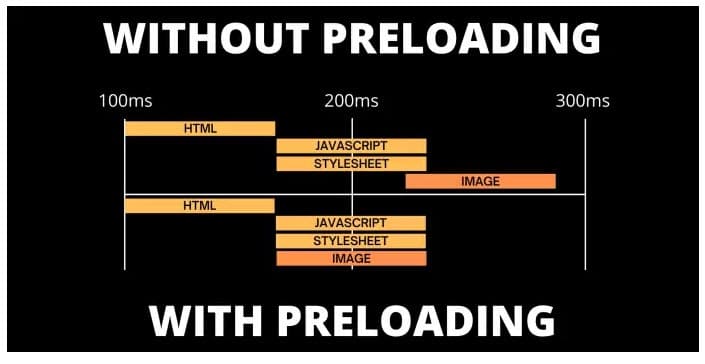
In that case, I would want to preload the image on the page so that it starts to load before the page even starts to render.
This way, the image starts to load immediately and is not slowed down by other code or requests.
This is a huge thing.
The standard practice is to lazy load all images on a page, to help with page speed. But when you do that to your LCP image, it actually makes it load slower, decreasing your LCP score!
(This is a big issue if you’re A/B testing your LCP element as well!)
So how do we fix it?
We want to write some code to specify that this particular LCP element should be preloaded on one particular page.
The script you want to add is the rel=”preload” script and it will look something like this:
In this example, I’m telling this particular page to preload the TRAFFIC-SMALL-HEADER image (which is the LCP image element for that page). I’m also specifying multiple dimension options so that it can load a responsive image for either mobile and desktop.
This change alone will help out any slow-loading images that are affecting your LCP score.
Some WordPress or Shopify themes will allow you to add custom code into the header of that particular page, while some plugins will allow this. Failing that, you can also edit the header.php file for your page and add the code directly.

I’ve covered some of the basics here but most of the fixes we’re going to cover can vary depending on your site and what you use. (If you’re not on WordPress or have a developer, then get them to check out Google’s Dev advice for optimizing LCP here).
As my site is built on WordPress, I’m going to be using the WPRocket plugin as it will help me fix the majority of the issues with LCP all in one place.
b. Use High Performance/Dedicated Hosting
A super simple fix to implement. When your user loads up your webpage, it sends a request to your web host for the page information and stored files, etc.
Some web hosting services work on a shared hosting platform. This means that they share the infrastructure between multiple sites. Because of this, it means that other sites’ traffic on your shared hosting can slow down your own site’s performance.
Moving to a dedicated hosting service that is 100% for your site only is not only faster, but also more secure, and can help with page load issues and server response times.
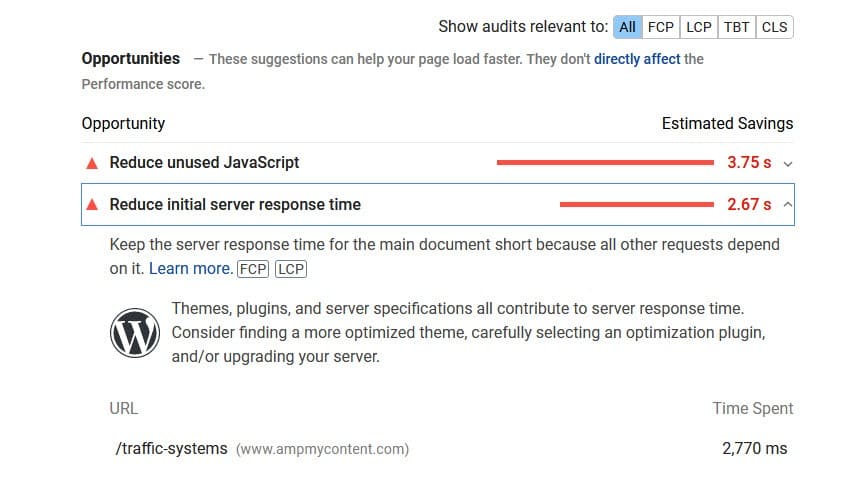
Here you can see that my site’s initial server response time was 2.67 seconds.
After upgrading to a dedicated host, it removed that server response delay completely, saving me 2.67s in load time, and also improved the Speed Index and Time to Interactive.
c. Enable Caching and Increase Cache Length (If Needed)
Caching allows you to save on server requests by storing a saved copy of your site content for users so that it loads fast on repeat visits.
This way if they come back and want to view the content again, it will load incredibly quickly.
d. Defer Non-Critical JS + Remove Unused JS
When a page loads, it takes turns either loading things one at a time (async), or slows down and tries to load multiple things at once (sync). This isn’t so bad if you have a fast server, or if the 3rd party application you are pulling from loads fast, such as the Convert Experiences app.
But, we can help improve our score and page speed by either deferring some elements (telling them to load after more important things) or removing elements that don’t need to be loaded on every page.
This is usually a large cause of LCP loading issues, as those elements try to load before the LCP element. (They can also affect First Input Delay).
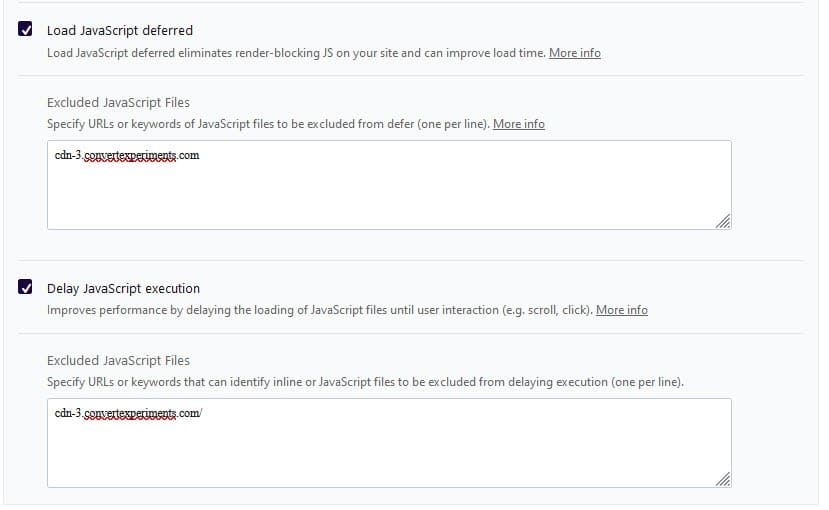
You can specify which JS, apps, or plugins to defer or remove inside WPRocket. (Just make sure to set the Convert script to load as a priority and not be deferred).
This way any non-essential JS is removed, other JS is deferred until used, and the Convert script can run asap.
Sidenote:
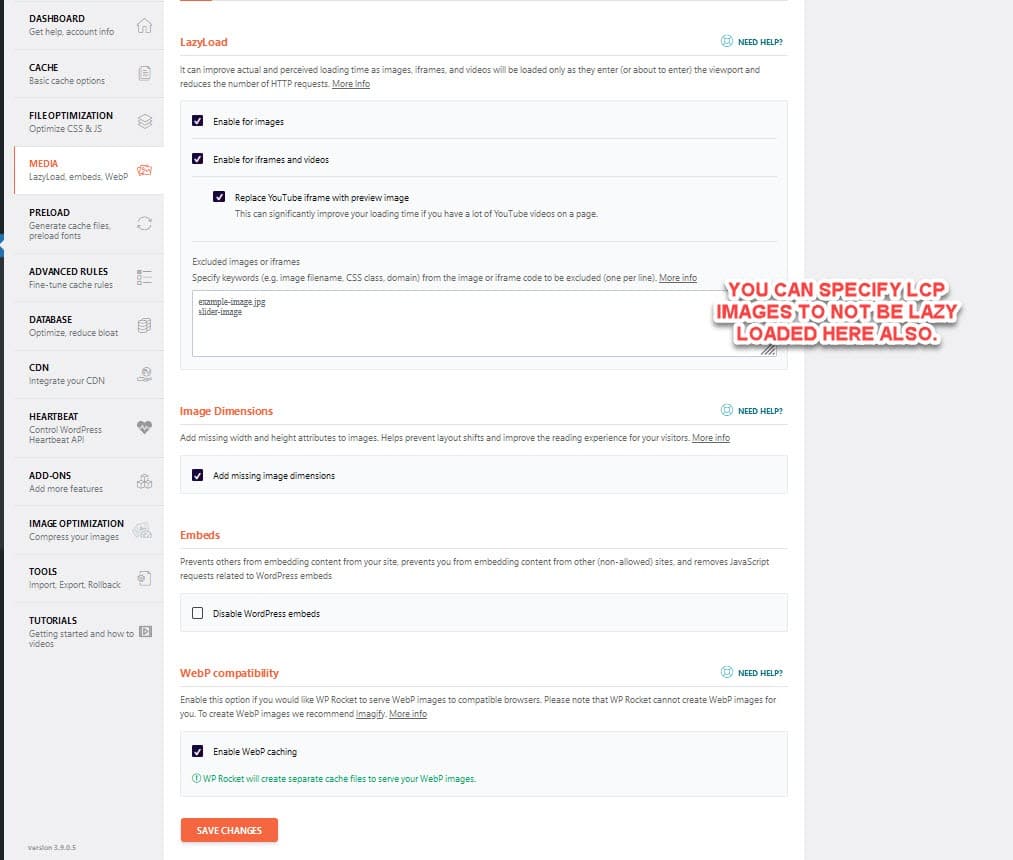
You can also use this section to prioritise loading of any above the fold elements such as sliders or carousels. Simply add the code to the exclusion section and it will load as normal.
e. Consider Code Minification
You can also speed up the page load time by minifying the JS and CSS code on your site. Minification is used to remove unnecessary or redundant data without affecting how the resource is processed by the browser e.g. code comments, white spaces and formatting, removing unused code, using shorter variable and function names, and so on.
A lot of plugins will allow you to do this.
Just make sure to check your pages after applying as it can sometimes cause issues. (Especially when combining code, which is why I haven’t used it here. It should work fine in theory, but I have had issues in the past.)
f. Optimize Images for Lazy Load and Responsiveness (Just Not The LCP Image)
Something that can slow down page performance is the image size and the volume of images that you have.
If you have an image-heavy page, you can improve the load speed by lazy loading the images so that the ones further down the page only start to show as the viewer scrolls down.
(Just remember to preload the LCP image though!)
You can also further help the page load by specifying specific image sizes. (Sometimes, you might upload an image that’s huge by accident which then slows the page down as it compresses it to the right size.)
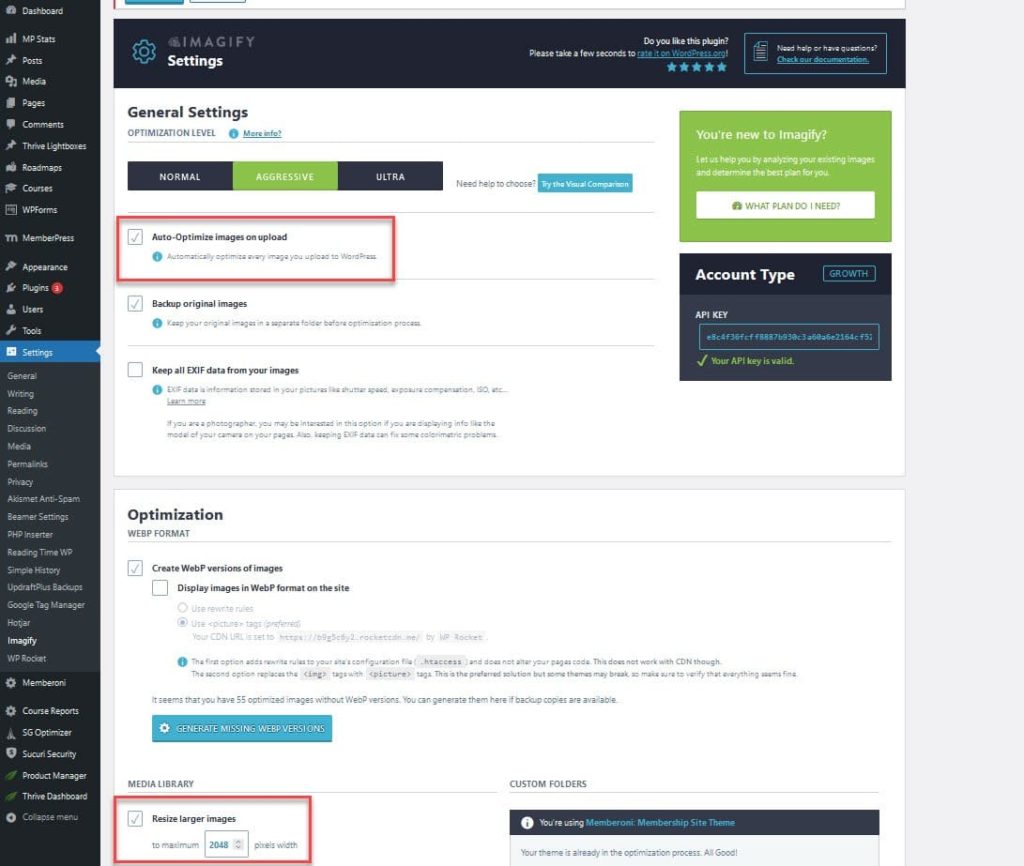
g. Use Image Compression and Responsive Sizing
You can make your images load even faster by reducing their file size, then delivering responsive sizes to suit the device that the user is on.
Smaller file sizes mean they require fewer resources for the user’s device to load, while still maintaining high quality from their perspective.
WPRocket also integrates with a plugin called Imagify to both compress and deliver responsive images (by adding multiple scrset options for different screen sizes).
h. Establish 3rd Party Connections ASAP
If you have content or scripts on your site that can slow down the page load, you can set it up to start preloading specific elements asap so they load faster.
Remember how my videos were slowing down my page before?
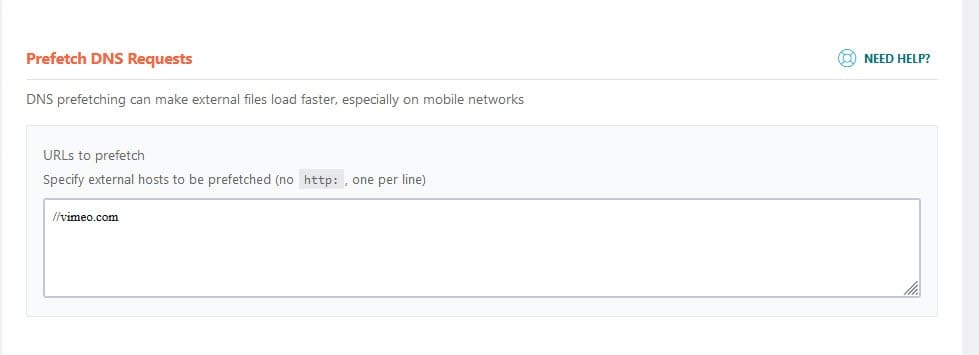
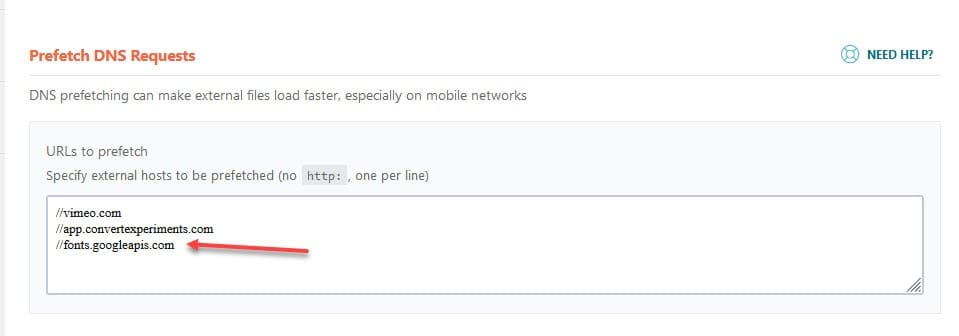
By setting up 3rd party DNS prefetch requests, I can speed up the loading of all those videos.
i. Use a CDN to Reduce Load Time
A CDN or Content Delivery Network helps speed up your site load speed even more, by saving cached versions of your site on servers that are closer to the user’s location.
You can do this with something like Cloudflare for free.
j. Use Gzip Or Brotli Compression To Optimize File Size
You can also speed up your site further by using a compression plugin such as Gzip or Brotli, but some CDNs will do it automatically so double check yours first to see if it has it installed. (Cloudflare has this built-in.)
So what was the impact of making all these changes?
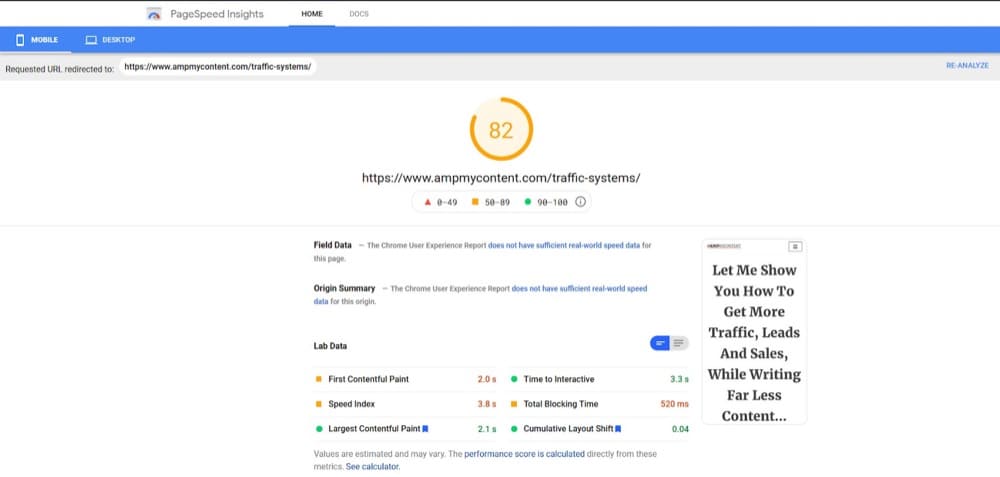
I’ve improved my site loading speed, taking it from 13.5 seconds down to 3.3 seconds on mobile. My LCP speed is now 2.1 seconds.
That’s a saving of 10.2 seconds!
Not bad, right?
There are still a few things to fix, but they should improve as we work on the 2 other Core Web Vitals.
2. First Input Delay (FID)
First Input Delay is a measure of how long it takes for the page to respond when the user tries to take an action, such as a button press or link click.
The most common causes of a poor FID are:
- First-party script execution causing a delay in interaction readiness.
- Data-fetching impacting interaction readiness.
- Third-party script execution delaying interaction latency.
First Input Delay is weighted as 30% of your CWV score and your goal is to get that response down to 100 milliseconds or less.
How To Improve Your First Input Delay Score
We can’t measure FID without a live user, so instead, we try to improve Total Blocking Time (TBT) as they are both connected.
So let’s look back at our page results…
Back when I first measured my page, my TBT was 1.5 seconds (or 1,560 milliseconds).
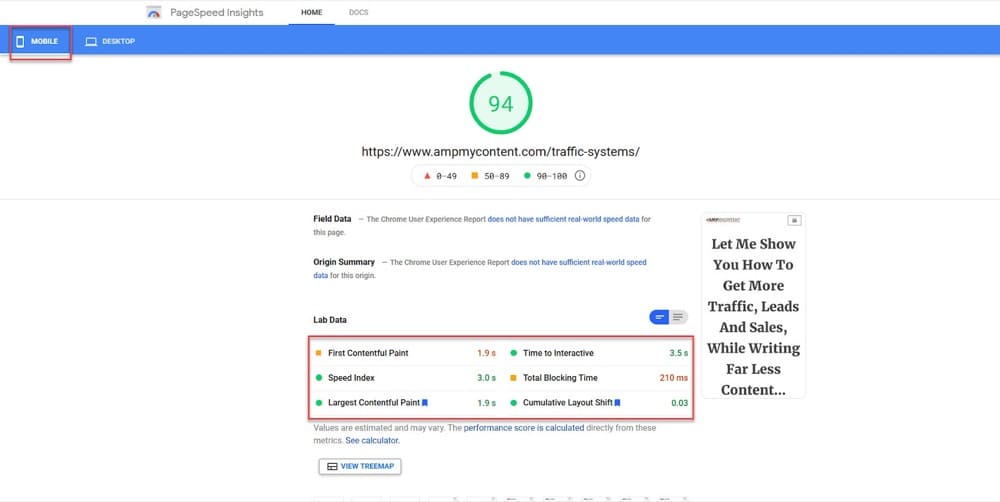
Since I improved the LCP elements, it’s dropped to 0.2 seconds (210 milliseconds), and 3.5 seconds until fully interactive.
This is because we’ve solved a few of the issues that slow Total Blocking Time already, simply by fixing some LCP issues such as code minification and deferring or removing JS.
It’s already close to the desired speed range but let’s show you a few other things that you can do, just in case your score isn’t quite there yet.
a. Pre-load Content And Links
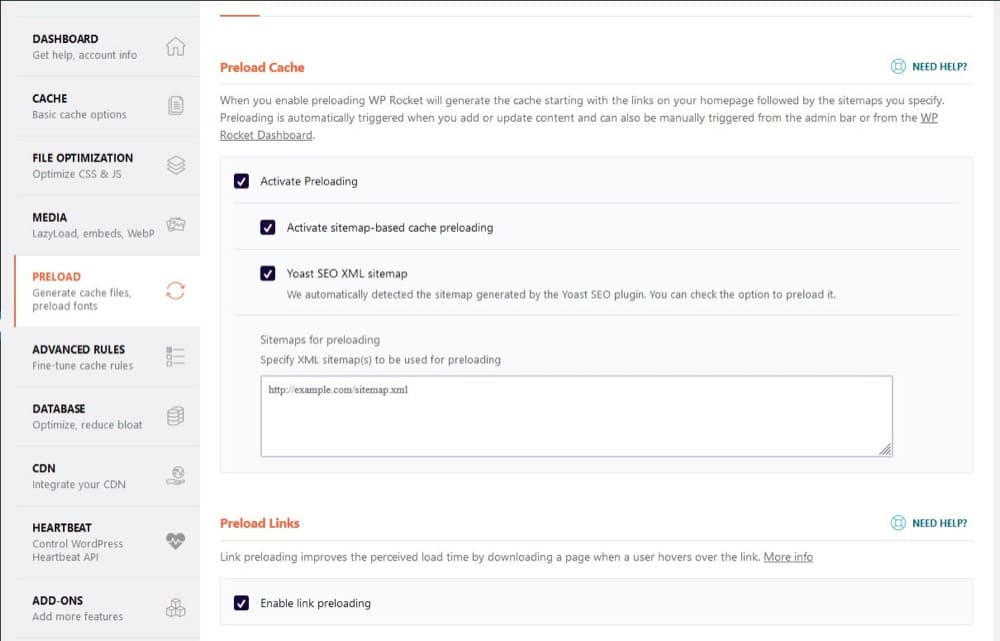
Here’s a cool feature inside of WProcket. With the pre-loading of LCP images, we’re telling the page to start loading the LCP image asap.
With pre-loading links and sitemaps, we’re telling the site to start preloading content in the background, when the user mouses over a button or link.
This means that those assets start to load before the user even requests them, speeding up that FID and lowering Total Blocking Time for those other pages that they click through to.
The benefit here is a faster FID on other pages, so let’s look at some more ways to improve the first page they load on.
The main thing we can do to improve FID is to remove code bloat from our site.
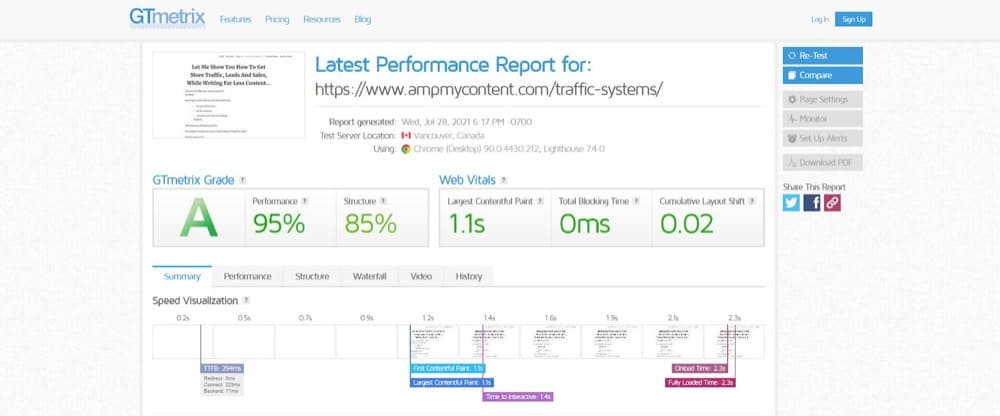
Go ahead and load up your page in GTMetrix.
Wow, that score looks amazing, right!?
Well, that’s because this is your Desktop score, not your mobile. (Unless you pay to customize the device and location, GTMetrix will always show a simulation of your page load from a Chrome user on a desktop.)
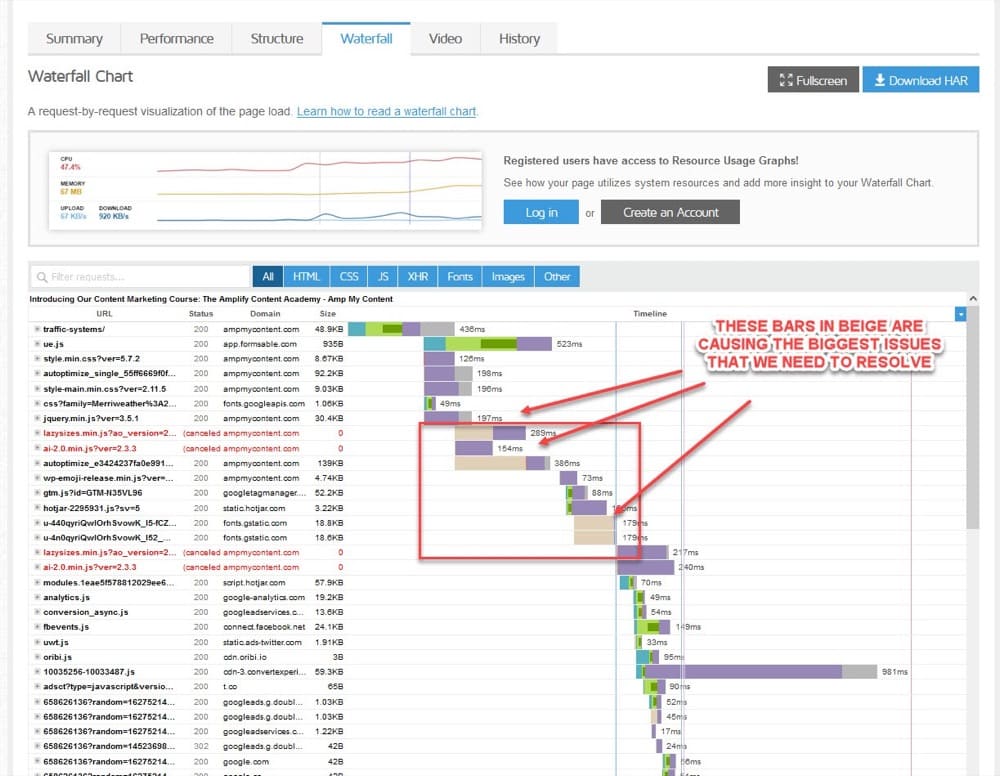
This is fine as what we want to look at is the Waterfall section, to see areas where your page load is being delayed.
The bars in beige are areas that we need to improve, as these are times where another code is being blocked from loading.
I can see in the waterfall that some old plugins and fonts are slowing down the page load, so I can go back and preload these custom fonts.
Open them up in the waterfall, then copy and paste the font URLs into WProcket. (I should have added them earlier but forgot whoops!)
So let’s look at a few ways to remove further blocking and code bloat.
b. Remove Plugin Bloat
If you’ve had your site for a while, then it’s very easy to start collecting a bunch of plugins and adding excess code that’s no longer needed.
You can speed up your site by removing unused plugins or duplicate plugins that perform the same task.
You can also:
- Update plugins to see if they run faster.
- Or look for alternative plugins that do the same thing for less code.
c. Remove Theme Code Bloat
Some themes have excess code built in to give design or style options that you might not need, causing the pages to take longer to load.
You can replace your current theme with a lighter one that meets your needs and see huge leaps in page speed and load time.
Personally, I use the Neve free theme because it’s clean and lightweight with just 75kb total install size, but you can use any theme you want. (Just search for ‘fast loading’ or ‘mobile first’ themes.)
d. Remove Page Bloat
Another major issue that can cause page bloat and CLS issues are Page Builders, mainly because of the excess code that they use to represent certain features.
You can see a much lower DOM score by either removing Page Builder plugins, or simplifying the page code, rebuilding it with the builder, or having a custom HTML page made.
So what was my score after changing this?
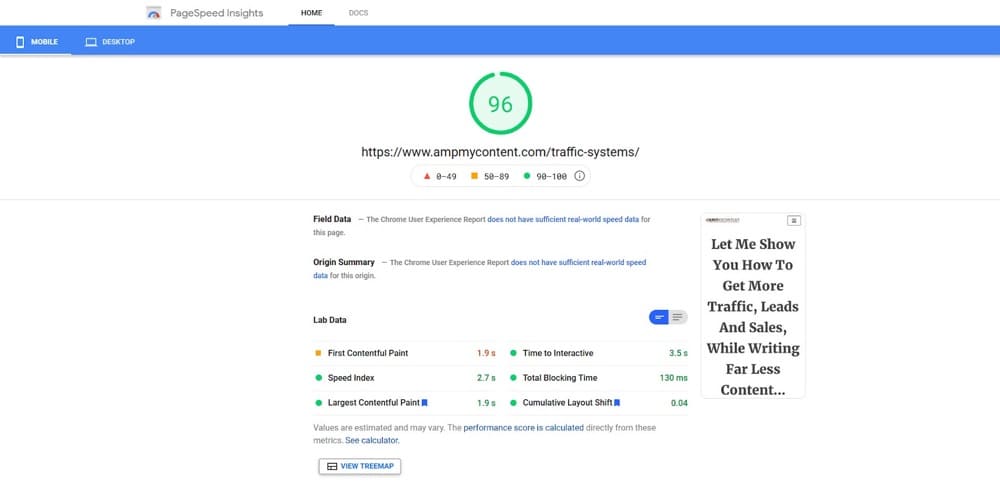
I haven’t removed my page builder yet, but the score still came down to just 130 milliseconds Total Blocking Time and the page loads in 1.9 seconds.
Want to improve your page speed even further?
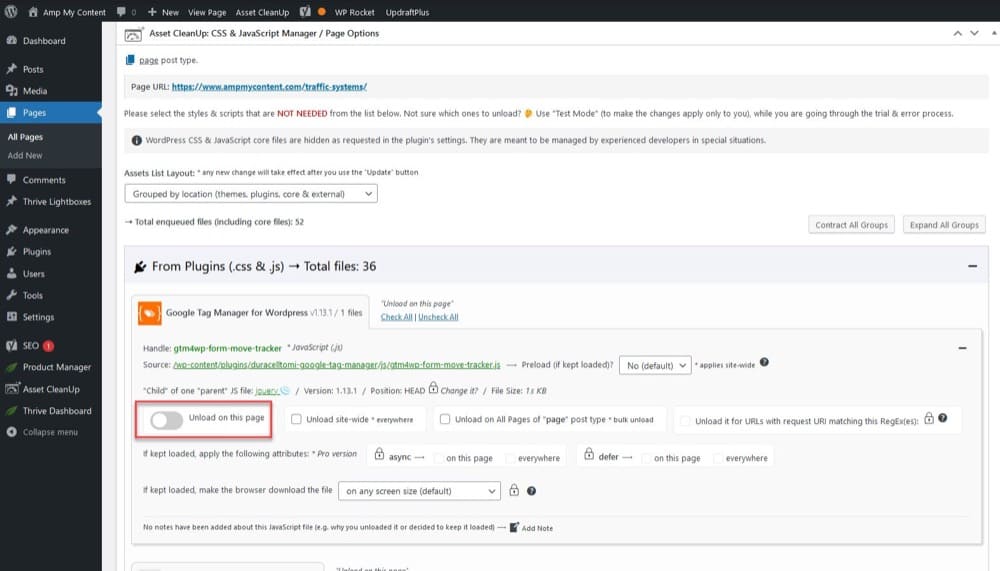
There’s another great plugin you can use called Asset Cleanup (it’s what our team uses at Convert).
It allows you to specify which plugins or assets load on each page of your site, helping you to remove unused plugins from specific pages so that they don’t add to load time unnecessarily.
For example, you could have a contact form plugin on your site, but its code is loading up on a page where it’s not needed.
With Asset Cleanup, you can go on that page and then scroll down and tell the plugin not to load on that particular page.
3. Cumulative Layout Shift (CLS)
Have you ever tried to click on something on a site and then it moves and an advert or banner shows instead?
Frustrating, right?
It’s especially important for us as optimizers, as a poor user experience like this can cause issues with broken UI or simply audiences not understanding what to do.
(Some unscrupulous people will actually build this in as a dark design to get specific clicks, etc. Especially sites selling ad space…)
CLS measures how much elements move around on a page (aka its visual stability) and then scores your site on this. Its goal is to stop these sites from creating this poor user experience, and its current weighting is 15% of your CMV score.
Your goal is to get a CLS score of 0.1 or lower.
It’s not just ads that can affect your layout shifts though. In fact, the most common causes of a poor CLS score are:
- Images without dimensions
- Ads, embeds, and iframes without dimensions
- Dynamically injected content such as ads in the sidebar or header that push content around
- Web Fonts causing FOIT/FOUT by changing from a generic to a custom font and affecting layout spacing
- Actions waiting for a network response before updating DOM.
The good news is that we’ve already solved a lot of this by fixing issues with LCP and FID.
- We’ve set image, ad, and iframe video dimensions.
- We’ve preloaded any custom fonts so they shouldn’t cause layout shifts.
- And if you removed your page builders, you should have lowered the overall DOM elements of your page, making it both faster and making fewer requests!
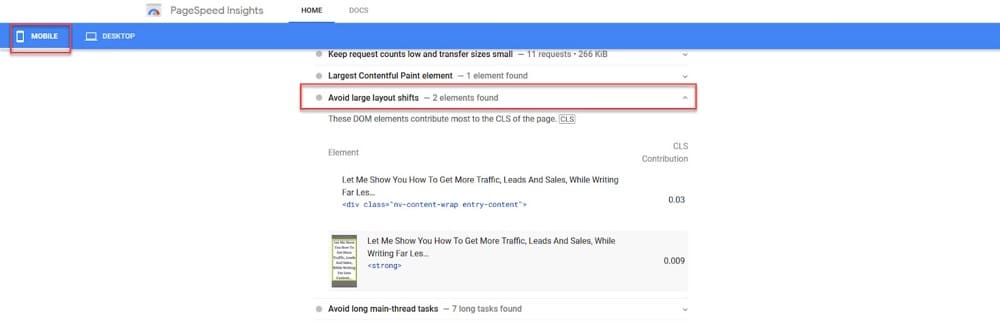
If you scroll down the PageSpeed Insights tool and click on ‘avoid large layout shifts’, you can see which elements of your page are currently causing CLS issues.
In my example, it’s simply the header changing to a responsive layout for mobile and isn’t affecting the CLS that much.
Your site may be different so have a look to see what’s causing issues and resolve them.
So now that we’ve covered each area of Core Web Vitals and how to improve them, let’s look at how your testing may affect your scores.
How Core Web Vitals Affect UX And A/B Testing (And How To Pass the Core Web Vitals Assessment While Using The Convert Script)
As long as you stick to best practices of what we’ve covered so far, you shouldn’t get too many issues, but let’s break them down.
How to not Negatively Impact the Largest Contentful Paint Score when A/B Testing
Remember that the LCP elements are what’s seen on the viewfinder or screen on the initial page load, so you might not even be testing any LCP elements, but just in case:
What if you’re testing an LCP element such as a new background, hero image, or headline?
The issue you might have here is not with the Convert Experiences tool, but rather with bad practices for LCP improvements.
Like we mentioned earlier, most people make the mistake of lazy loading all images, including the LCP image, which affects the LCP score.
Convert Experiences uses both ‘synchronous load’ and ‘body hide’ methods to run tests. Simply put, the tool recognizes the element to be tested and then hides it as soon as it starts to load so the user never sees it, before changing it in under 50 milliseconds.
If you’ve lazy-loaded that LCP element though, the Convert Experiences app is going to have to wait for that element to load before it can do its job.
You can fix this by preloading the specific LCP elements on your control and test pages like we suggested above. This will get them to start loading immediately on page load, allow them to be recognized and hidden by the Convert app, and be replaced asap before the user notices.
Not only will this reduce flicker, but it will also give a good LCP score as the main LCP element (even when tested) will load fast.
And if the LCP element is not what you’re testing? You should be pre-loading it anyway to improve that LCP score.
How to Improve First Input Delay when A/B Testing
The Convert code is incredibly fast, but your FID score still relies on all the other elements of your page.
Make sure to hit all the main requirements for speed that we talked about before so that there is no delay in the Convert code running. (Otherwise, the element you are testing will be hidden until it loads and then changes.)
- You can remove code bloat from other JS and defer them from running.
- You can also ‘exclude’ the Convert script from being deferred so that it loads up before any other JS so that it can make those test changes asap, while not hurting FID.
If you don’t prioritize the Convert code and instead defer it by accident, it may not affect your FID score that much, but it might cause your test element to delay loading, while the script waits to run.
How To Decrease Cumulative Layout Shift Issues When A/B Testing
The potential issues with Cumulative Layout Shift and testing come down to how you run a layout test.
Ideally, you don’t want to test massive layout changes with just the Convert Experiences editor. Instead, you want to test similar elements for variations i.e. swapping out a hero image for another image or swapping text for variations, etc. This means that the page layout stays the same, but a key element is swapped out for a variation.
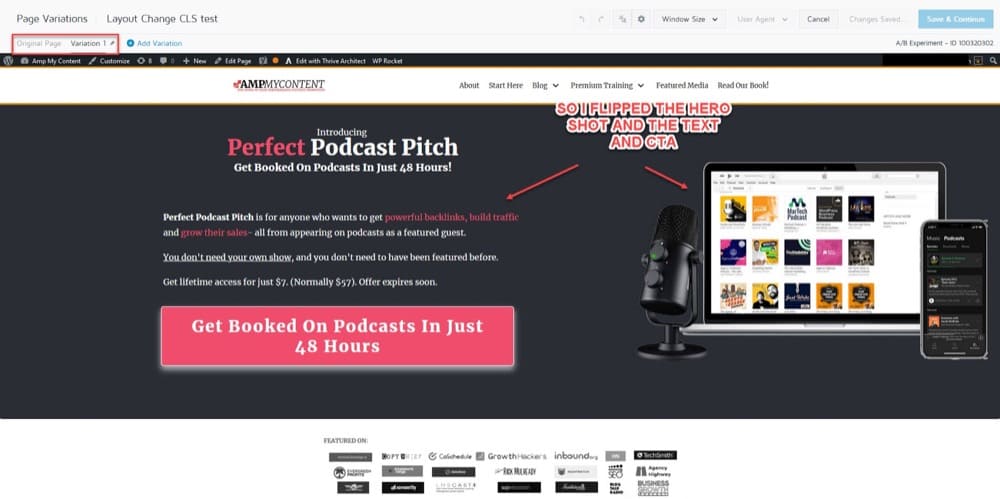
But what if you want to test a minor layout shift, such as swapping the hero image and text location?
I recommend using Convert Experiences for small layout shifts to set up the test and then see how much it affects your CLS score before you push it live.
A real-world example:
Let’s say that I set up that same flipped layout test as above. First, I would build the test inside the Convert Experiences app.
Then I can test this page variant in the page speed tool to get an idea of how it affects CLS.
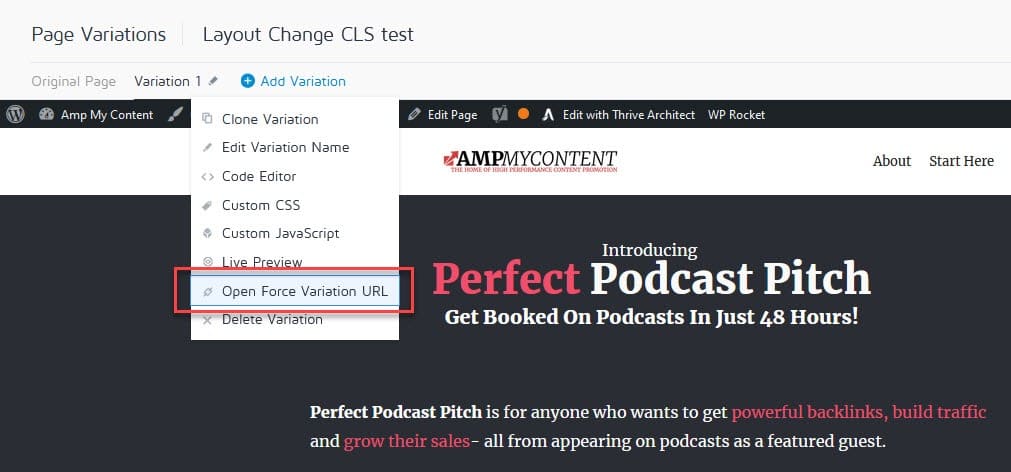
Make sure you have the variant page open, and then click on the pen icon next to the variant in the Convert Experiences app, then select ‘Open Force Variation URL’:
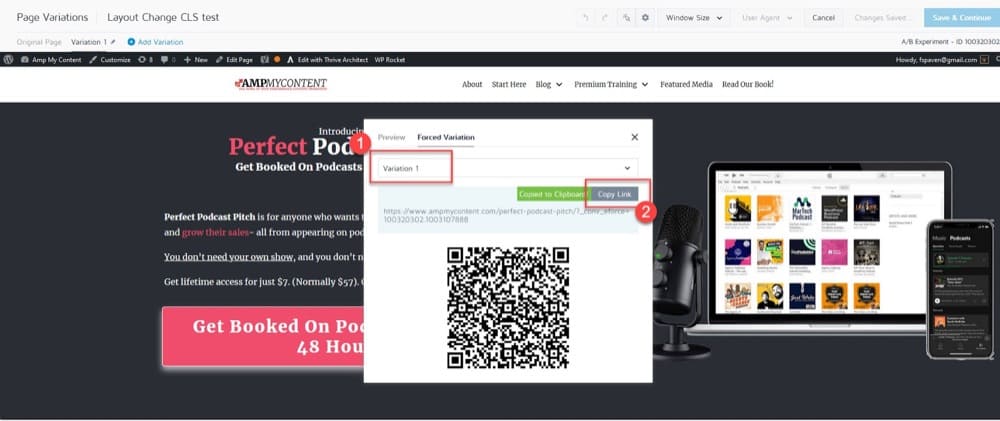
This will load a pop up.
Make sure you have the variation page highlighted and then click to copy the URL.
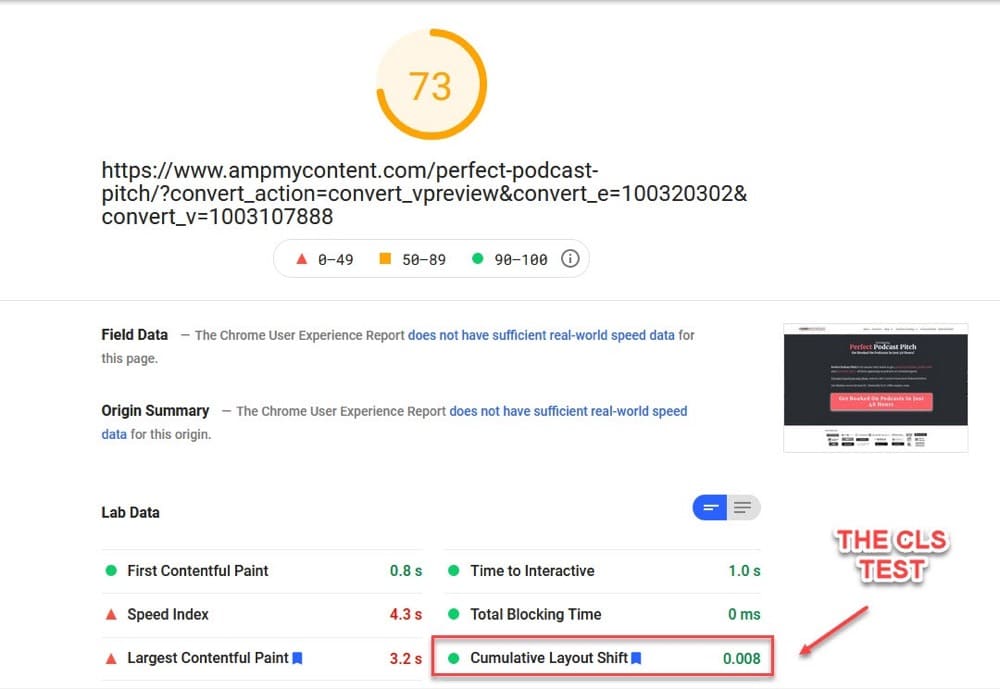
You can input that URL into the PageSpeed Insights tool and measure the CLS and other CWV vitals for that variant.
Full disclosure:
In this particular example, I have not fixed any of the code bloat issues on this other page yet, but here you can see the original control page results based on just the LCP improvements.
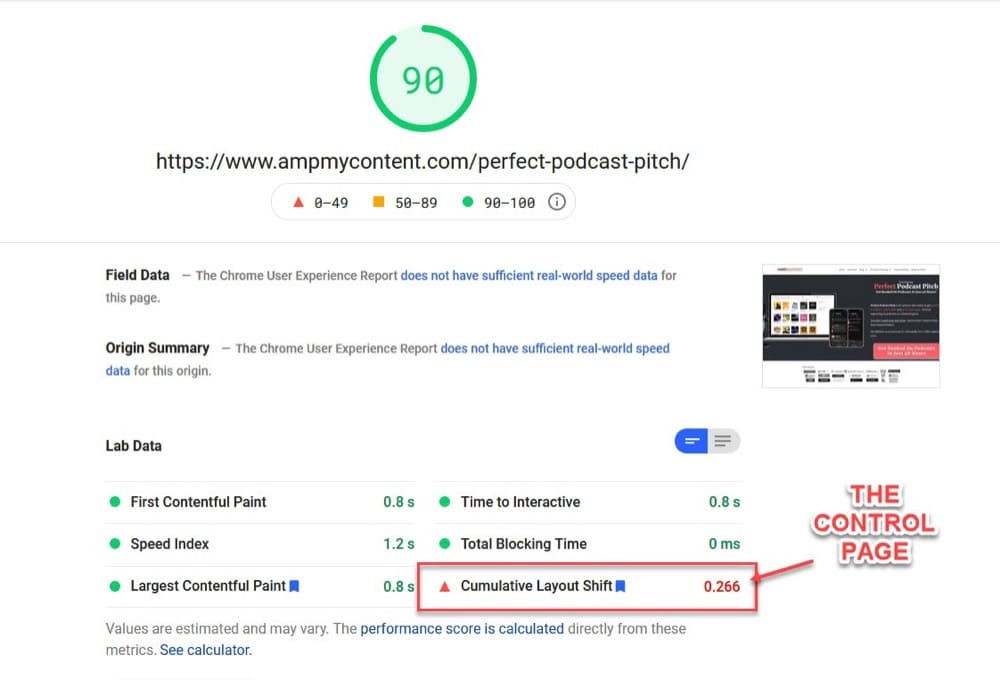
The speed and TBT are great, but the CLS is outside of our goal on the control page, due to the page builder I use on my website still causing issues.
But, just out of interest, let’s compare that CLS score on the control page to the variant’s results:
As you can see, the CLS on the variant page is fine to use as the score is still within guidelines.
(The speed issues would be fixed once I sort code bloat issues with my page builder, but the Convert Experiences app and layout test run incredibly fast.)
So small layout changes can work, just be sure to test them first before pushing them live.
But what if you want to test large layout shifts, such as a total redesign or page elements removed or added?
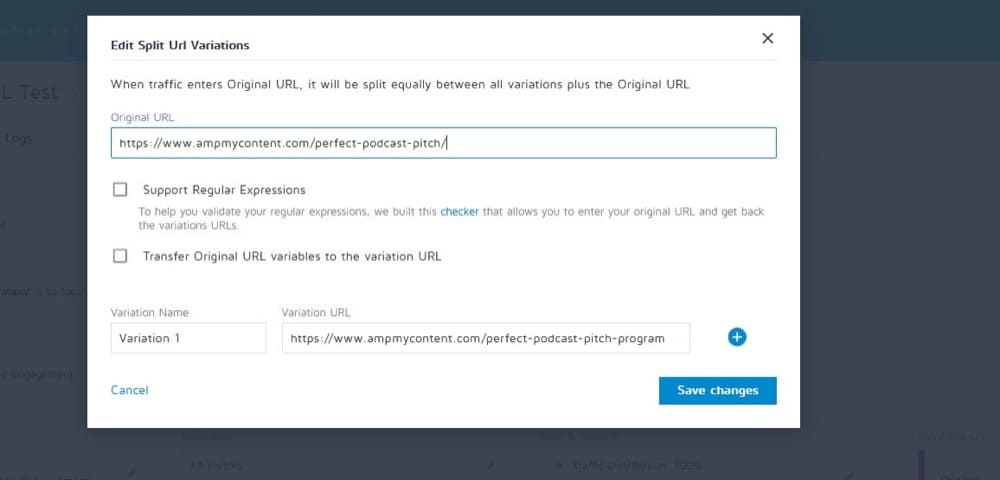
In that case, I’d follow the same best practice for testing dynamic redesigns or large layout changes, which is to run split URL tests instead.
Instead of using the Convert WYSIWYG editor to tweak and remove all the excess text elements, it would be more efficient to run a split URL test with the variation page fully edited and built in advance. (This is a best practice regardless of CLS).
This way you can test the variation page versus the control and get a fast load time for both, without affecting your CLS score with those major layout shifts.
Conclusion + Key Takeaways
So there you have it. Our complete guide to Google Page Experience, the 3 Core Web Vitals update, how your testing might affect those vitals, and how to improve your score.
Want to tweak it even more?
Depending on your particular use case needs, you can even edit the Convert Experiences app to run asynchronously, to stop the body hiding feature, or to even use async and remove the body hiding feature at the same time. (You might want to do this to help load even faster and stop other assets waiting for the tool to finish loading).
Most users will never need to do this, especially if you follow the best practices that we’ve laid out so far. (And if you’re still struggling, you can always reach out to our support team if you’re a Convert Experiences user.)
Remember:
- The Convert Experiences app is incredibly fast, but it can work better if you follow best practices for Core Web Vitals & A/B testing.
- Google rarely gives information on particular ranking signals, so Page Experience and Core Web Vitals are important and may continue to become more important in the future. (They’ve already increased the site speed thresholds since earlier releases.)
- According to Google, Core Web Vitals is the tie-breaker when all other things are equal, so it’s worth doing when competing at a high end. If the content or offer is equal in quality, and the competing pages’ Page Rank is similar, then user experience will dictate search page rankings.
- Core Web Vitals is concerned with actual user experience on-page, so this is important for CRO. It’s worth applying the best practices as this can affect page load speed, bounce rate, CTR, conversion rate, and more, especially on mobile devices.
- Core Web Vitals may even start to affect paid traffic landing Page Experience and how you show up in ad auctions/cost to run ads. Improving this may affect ad costs and delivery.
- You need to have the basic elements in place to meet Page Experience requirements. Fast loading, CDN, caching, HTTPS, before you look at other elements to improve.
- Code bloat and loading order can affect both First Input Delay and Largest Contentful Paint. You need to know how to set up, restrict, pre-load elements or defer JSS and CSS to load your page effectively.
- When testing content that is above the fold (in the viewing area on any device), be aware of the LCP element and the need to preload it to reduce LCP issues – especially if that is your test focus.
- The Convert Experiences app runs so fast that it will not affect Core Web Vitals negatively, assuming you are running A/B tests where large layout changes do not shift. (Swapping out elements for similar elements, text for text, images for images, button variations, etc). Otherwise, this would affect CLS. (You can always test any layout change variations before pushing live.)
- When performing larger layout changes, split URL testing is advised (as you would anyway for a dynamic test) as this will affect CLS. Just be sure to update the winning variation to the original URL and 301 redirect any links that variations may have got (rare situation).
Written By
Daniel Daines Hutt

Edited By
Carmen Apostu

