Optimization Beyond A/B Testing: The Answer To Testing On Low-Traffic Sites
A/B testing has rightfully earned its place as the gold standard for validating ideas and driving optimization.
Nothing is more trustworthy (well, meta-analyses of trustworthy experiments are right up there1) than adequately powered A/B tests, run from a balanced backlog, and rigorously checked for perverse incentives.
But what happens when you don’t have enough traffic to run a valid A/B test? This is a common challenge many teams face, especially those working on low-volume flows or niche products. Reaching statistical significance in those instances can take months.
Heavy reliance on meta-analyses that address just one of these aspects is problematic, as analyzing PDPs (Product Detail Pages) across various industries isn’t trustworthy.
Conversion.com acknowledges this distinction in their benchmarking reports by examining different site areas.
The misuse of meta-analysis in optimization work is evident in examples like checkout page analyses involving different industries and beauty product website analyses comparing different site journey parts.
This is where the nuance of optimization comes into play. As Ruben de Boer from Online Dialogue points out:
Not all evidence is created equal. This all has to do with three aspects:
- Target audience representation
- Control over variables
- Sample size
With A/B testing, you run an experiment on your target audience. If testing with the right numbers for statistically valid experimentation, the sample size is large enough. And as you are running a randomized controlled trial, there is control over the variables. This means that (external) events impact both the users in control and the variant.
Ruben de Boer, Online Dialogue
Ruben has created a guide on low-traffic A/B testing. Sign up to his newsletter to get it for FREE: https://conversionideas.com/cro-tips/
Getting around the low traffic problem in statistically sound ways isn’t a walk in the park — you’d need a data scientist onboard. But that doesn’t mean we should abandon optimization altogether when A/B testing is off the table.
Psst..This isn’t an invitation to replace hard labor with gut instincts or defer to expert opinion.
Here’s the thing: A/B testing is still the best way to mitigate risk. No other method can match the quantitative scale and rigor of A/B testing.
We must keep these limitations in mind when working with “lower-quality evidence.”
And above all, triangulation is key.
If we want customers to improve their user experience successfully and thus their conversion rates — we have to lay out a viable plan B. This guide to optimization beyond A/B testing is just that — a responsible plan B for when traffic is low but the desire for improvement is high.
We’ll explore the hierarchy of evidence, discuss how to triangulate multiple research methods and provide best practices for mitigating risk without controlled experiments. We’ll also hear from experts who have navigated this challenge before.
Experimentation & Optimization Are More Than A/B Testing
Your customers’ growth is being stifled by a myopic view of experimentation and optimization.
Because here’s the thing: CRO is more than just A/B testing.
Achieving meaningful results requires a holistic optimization strategy that includes thorough conversion research, hypothesis generation, and validation through diverse testing methods.
CRO expert Raphael Paulin-Daigle, CEO of SplitBase, asserts, “Conversion Optimization is NOT A/B testing. But many brands get that wrong and waste months testing things without getting any results.”
He points out the fundamental principle of testing: validating ideas using evidence rather than relying on guesswork or gut instinct. But this validation process should not be limited to statistically significant controlled experiments within an A/B testing platform.
Raphael’s “testing trifecta” framework is a powerful tool for testers aiming to create an effective optimization program. It combines three key elements — analytics, human research, and testing.
Jonny Longden, Group Digital Director at Boohoo Group PLC, draws a compelling analogy between science and experimentation in business:
Imagine if ‘science’ were limited like this; the only place experimentation ever happened was in test tubes. The only thing that could be tested would be chemistry, and it would have to use a test tube and produce statistically significant results. Modern civilization wouldn’t have gotten very far.
Similarly, limiting experimentation to a single method or platform, like A/B testing, hinders our ability to drive business growth.
Longden advocates for applying the scientific method—Research > Ideation > Solution Design > Validation > Learning & Iteration—to various aspects of a business.
Successful optimization sprints can happen without explicit A/B testing involvement. Let’s dig into some real-life examples:
Airbnb: Observing User Behavior
- What They Did: Airbnb noticed hosts frequently sending photo messages to guests for check-in instructions. They developed a global check-in tool allowing hosts to create visual guides.
- Impact: Improved user experience by making check-ins more seamless and consistent.
- Note: Continuous observation of user behavior led to the discovery and refinement of the tool.
Google for Education: User Feedback for Rapid Adaptation
- What They Did: During the pandemic, Google gathered feedback from teachers to improve Google Meet, adding features like attendance taking and hand raising.
- Impact: Enhanced user experience for teachers and students, benefiting all users.
Spotify: Balancing Data and Human Perspectives
- What They Did: Developed the “Shortcuts” feature using machine learning, but chose the name “Good morning” based on human perspective despite inconclusive A/B test results.
- Impact: The feature delighted users and led to further improvements like time-based recommendations.
Spotlight: Rapid Experimentation at the Financial Times
The Financial Times Apps team set out to create a habit-forming app.
Through 27 hours of user interviews, a diary study with 150 diary entries, and a survey with 471 respondents, they identified key features that encourage habitual app usage.
Rapid experimentation allowed them to test numerous concepts quickly. This approach involved initial quick tests, including A/B tests, to validate the habit-forming potential of features and iterated those that showed promise.
For example, fake door tests (also known as painted door tests) were used to gauge user interest in new features like games. By presenting users with options that didn’t yet exist and gathering feedback, they validated the potential value of these features with minimal effort. This rapid experimentation process enabled them to identify and develop habit-driving features efficiently, significantly enhancing user engagement with their app.
Expert Tip: Product feedback and surveys can be a good way to create optimization sprints for product features.
When you don’t rely solely on A/B testing to validate your ideas, you are less likely to run full speed in the wrong direction — a common pitfall with false-sense-of-security A/B tests that lack rigour. Haley Carpenter from Chirpy further elaborates on this.
Unfortunately, many case studies boasting mythical lift numbers—30,000% improvements (yes, we’ve been guilty of publishing such stories in the past. *shivers in horror*)—are often unreplicable because the tests were underpowered or based on bad data practices.
Optimization efforts, when approached with the right intentions and an appreciation of the inherent risks, can yield better, more sustainable results.
Jon MacDonald, CEO of The Good, discusses this approach in his concept of “rapid validation.”
He argues that A/B testing, while valuable, should be just one tool in the optimization toolkit. Depending on your team’s culture and capabilities, the “test everything” mantra can be as detrimental as not testing at all.
Rapid validation and prototyping can offer a practical alternative, enabling quick, iterative gains through research and quick experiments.
Rapid validation involves moving faster by saving months-long A/B tests for significant opportunities and using quicker tests for fast, user-tested decisions. This approach minimizes risk, validates ideas before full-scale changes, and remains data-driven through various methods, not just A/B testing.
Concrete Ways to Optimize Without A/B Testing
It’s a dangerous myth that only large businesses can run A/B testing programs.
Higher volumes simply mean greater confidence, but any confidence is better than no confidence, so you can still adopt all the methods and practices of a good experimentation program to be as confident as you possibly can.
Jonny Longden, Group Digital Director at Boohoo Group PLC
Jonny shared these 5 tips on LinkedIn:
- Test upstream metrics
- Invest time in research and analytics
- Be bold and radical with ideas
- Accept lower confidence levels
- Broaden your concept of “validation”
Ronny Kohavi, Experimentation Consultant and Instructor offered some more nuance to Jonny’s actionable tips:
- Test Upstream Metrics: Surrogate metrics can be helpful if they causally impact your main metrics. Focus on metrics closer to key outcomes like revenue for more actionable insights.
- Invest in Research & Analytics: Generate impactful ideas that can improve key metrics by 20% or more. Start with industry best practices from resources like Jakub Linowski’s GoodUI or the Baymard Institute.
- Have Radical Ideas: Pursue bold ideas with significant effects, but be prepared for higher failure rates and the possibility of false positives.
- Accept Lower Confidence Levels: For short-term decisions, lower confidence levels can work. For meaningful learning, stick with higher confidence levels to avoid significant error rates.
- Use Other Validation Methods: Until your traffic grows, use expert opinions and other validation methods, while being aware of their limitations compared to A/B testing.
Next Up: We’ll explore the various methods practitioners use to optimize beyond traditional A/B testing.
NOTE: This section is for inspiration only. We are not endorsing any particular method or process. The choice of approach depends on the reader’s grasp of causality, fidelity, and triangulation.
User Focused A/B Testing by Rich Page
Traditional A/B testing for websites often falls short by not revealing why visitors prefer one version over another, offering no visitor feedback on tested improvements, and requiring high traffic volumes to be effective.
Rich Page’s approach to A/B testing i.e. User-Focused A/B Testing addresses these limitations by uncovering the reasons behind user preferences and providing valuable feedback without needing extensive traffic.
Here’s Rich’s 7-step process:
- Create a new version of the page you want to improve. Use insights from conversion research to guide your changes.
- Run a preference test to gather quick feedback from 100 users on which version they prefer and why.
- Implement recording tools to observe real user behavior on both versions and spot differences in engagement.
- Set up a brief on-site survey to collect insights from your website visitors in their natural browsing context.
- Engage 5 participants in user testing. Watch their real-time interactions and collect rich, qualitative feedback.
- Compile all collected data, look for patterns, and select the best-performing version.
- Roll out the winning version and keep a close eye on key metrics.
Here are the key pros and cons of this user-focused A/B testing technique:
Pros
- User-Centric Insights: This method focuses on understanding the “why” behind user preferences, providing deeper insights into user behavior and preferences rather than just indicating which version performs better.
- Feedback-Driven: Incorporating user feedback directly into the testing process ensures that changes align more with actual user needs and expectations.
- Less Traffic Required: Unlike traditional A/B testing, which requires substantial traffic to achieve statistically significant results, user-focused A/B testing can be effective even with lower traffic volumes.
- Qualitative Data: This approach includes qualitative data collection methods such as preference tests, user recordings, and surveys, leading to more comprehensive insights.
- Actionable Improvements: The feedback and insights gathered can lead to high-impact website improvements that are more likely to increase conversion rates and revenue.
Cons
- Resource Intensive: This method can be more resource-intensive, requiring tools for user testing, visitor recordings, surveys, and qualitative analysis, which may increase costs and time investment.
- Complexity: The process involves multiple steps and tools, making it potentially complex to implement and manage, especially for smaller teams or those with limited expertise in CRO (Conversion Rate Optimization).
- Potential for Bias: User feedback can introduce biases, as responses may not always represent the broader audience. This can affect the objectivity of the insights gathered.
- Dependency on Tools: The effectiveness of this approach heavily relies on the availability and functionality of specific tools like UsabilityHub, Hotjar, and Userfeel, which may have limitations or require subscriptions.
- Limited Quantitative Data: While the method excels at providing qualitative insights, it may not always offer the robust quantitative data needed for certain types of analysis or decision-making.
Before/After Analysis or Pre-Post Analysis
Before/after analysis compares two samples from different time periods, making it weaker than making it weaker than A/B testing because it analyzes changes happening in separate timeframes rather than running tests on variants simultaneously.
Also known as pre-post-intervention analysis or time series analysis, this method requires manual statistical analysis. Pairwise analysis, a part of this process, is complex and often frustrating.
André Vieira, Founder of Looptimize, discusses this method in his LinkedIn post and offers insights into alternative approaches when A/B testing is impossible. This method involves comparing key metrics before and after an intervention to assess its impact.
Sidebar: Deep statistical knowledge is necessary to pull off a before/after analysis. But with an A/B testing tool like Convert, all that calculation is done for you.
How to Conduct a Before/After Analysis
A note from our resident expert, Karim Naufal, Data Whiz at Convert:
When conducting a before/after analysis — a simulation spread over time of an A/B test — it’s important to ensure you’re comparing apples to apples. Here’s how to do it effectively:
1. Consistent Business Cycles: Run each part of the analysis during the same business cycles. If one part runs from Monday to Monday, the second part should do the same, starting and ending at the same hour. Ideally, use two-week cycles, or at least one complete cycle for each part.
2. Avoid Special Events: Ensure that neither period includes special events like election day, Black Friday, or national holidays. This keeps the comparison fair by avoiding anomalies.
3. Stable Product Catalog: For shops, ensure the product catalog and item availability remain unchanged during the analysis periods. This prevents external factors from skewing results.
4. Control Marketing Factors: Regulate marketing spend, campaigns, and channel distribution to maintain consistent external conditions.
By keeping these conditions similar, you can approximate a real A/B test more closely.
- Define Key Metrics: Identify the metrics that will be used to evaluate the impact of the changes. Common metrics include conversion rates, bounce rates, average session duration, and revenue.
- Establish a Baseline: Before implementing the changes, collect data on these metrics for a period. This baseline serves as the point of comparison for post-change analysis.
- Implement the Change: Make the changes to the website or app.
- Monitor Post-Change Metrics: After the change is implemented, continue to collect data on the same metrics for a comparable period.
Note: It’s important to gather the same sample size, in terms of the number of visitors. A slight difference in numbers isn’t a problem as long as it passes a sample ratio mismatch (SRM) test. - Compare and Analyze: Compare the post-change data to the baseline data to determine the impact of the changes. Use statistical methods to assess the significance of any observed differences. Once all the data has been collected, A/B testing calculators can be used to analyze the results.
Pros
- Simplicity: Before/After Analysis is straightforward to implement, making it accessible for teams without advanced testing tools or expertise.
- Flexibility: Can be used in various scenarios where A/B testing is impractical, such as site-wide changes or low traffic situations.
- Immediate Insights: Provides immediate feedback on the impact of changes, which can be useful for rapid iteration and decision-making.
- Overall Impact: Captures the total effect of changes, including indirect effects that might not be isolated in an A/B test.
- No Traffic Splitting Needed: Suitable for situations where splitting traffic is not possible or practical.
Cons
- External Influences: Results can be influenced by external factors (e.g., seasonal trends, marketing campaigns) that affect metrics independently of the changes made.
- Lack of Control Group: Without a control group, it is difficult to attribute changes in metrics solely to the intervention, as other variables may be at play.
- Potential Biases: Pre-existing trends in the data can bias the results, making it hard to isolate the effect of the changes.
- Consistency Required: Conditions before and after the change must be consistent to ensure valid comparisons, which can be challenging to maintain.
- Limited Robustness: Lacks the robustness of randomized controlled trials, making it less reliable for drawing definitive conclusions about causality.
Alternatives to Before/After Analysis
- Difference in Differences (DiD): This method compares the changes in outcomes over time between a treatment group and a control group. It helps control for external factors that could influence the results.
The key difference with DiD (Difference-in-Differences) is that it doesn’t rely on random assignment to groups. DiD is more commonly used in policy evaluation and anthropology studies than in optimization for various reasons. - Causal Impact Analysis: It is particularly useful for analyzing the impact of changes when a randomized experiment is not feasible.
- Statistical Regression Analysis: Methods such as linear or logistic regression can be used to control for various factors and isolate the effect of the changes being analyzed.
Customer Research Or Feedback
A/B testing isn’t the only way to optimise your website. If you don’t have enough traffic, there are still other methods you can use to validate your hypotheses and come up with new ideas for your website. Our favorite at Customers Who Click is customer research or customer feedback. Speaking to your actual audience is essential if you want to build a sustainable business in 2024. They’ll tell you about their pain points, their desired outcomes, what convinced them to buy, and what held them back. Simply focusing on these four things can generate big wins for your business.”
Will Laurenson, CEO and Lead CRO Consultant, at Customers Who Click
How to Gather Customer Feedback:
- Email Surveys: Send an email survey to recent purchasers and non-purchasers on your list. Ask for qualitative responses to understand what customers care about. Questions might include:
- What are you hoping to achieve with our product?
- What information was essential to you about this product?
- What has stopped you from making a purchase from us?
- Review Mining: Analyze reviews for recurring themes. Look for both positive feedback (useful for advertising and messaging) and negative feedback (to identify areas for improvement). Competitor reviews can also be valuable. Pro tip: Check out our AI Playbook for Research, CRO and Experimentation for prompts that can streamline your review mining process using AI.
- Customer Service Audits: Review your customer service tickets to identify common questions. Address these on your website and in emails to improve customer experience and reduce ticket volume.
- Customer Interviews: Conduct interviews to dive deeper into survey responses. Follow up on points of interest to gain more detailed insights. Questions might include:
- “You mentioned X, can you tell me more about why that is particularly important to you?”
- “You said you’d tried {competitor product} in the past, what did you like/dislike about that?”
Case Study: Groove Pillows Using email surveys and interviews, they discovered that their ergonomic pillow was too focused on its features and not enough on its benefits. By switching their focus and testing new content around the CTA and in the image gallery, they achieved a 53% increase in conversion rates over six months.
Data-Driven Methods + AI
Heatmaps, click maps, pop-up and post purchase surveys are just some of the many data driven methods that can build strong hypotheses behind implementation of new designs. The probability of it increasing conversion rate is much higher when using this approach vs. just trusting your gut.
Scraping product reviews and using AI to prompt to search for reasons why people are not buying and what benefits people care about the most are also low-effort ways to begin to collect data to synthesize.”
Daniel Chabert, CEO and Founder of PurpleFire
Heatmaps help you visualize your traffic’s jobs to be done. Don’t compromise on the insights you can glean from them. We’ve broken down 40 of the most popular heatmapping tools out there.
Thorough User Testing
Take a step back in the hierarchy of evidence. The hierarchy of evidence comes from science and was introduced in CRO by Ton Wesseling. With thorough user testing, you can validate a lot of your ideas. Most will know 5-second testing, preference testing, card sorting, tree testing, and testing on Social and Google ads.
But you can also do prototype usability testing, test single feature MVPs, smoke testing, create a simple landing page, and many other forms of user testing. As with A/B testing, you need a process.
At Online Dialogue, we have a process where we conduct several user tests to validate innovative ideas before they become an A/B test.Ruben De Boer, Lead Conversion Manager at Online Dialogue
Behavioral Science Can Bring More Credibility to Optimization Methods That Aren’t A/B Testing
As Line-Ariel Bretous, Founder of 1 LAB Consulting Group, notes,
In scenarios with limited sample sizes for A/B tests, the principles of behavioral science are invaluable.
Why? Because it encourages adopting the customer’s perspective and focusing on real human behavior, not just idealized rational actions.
Think about it this way: Studies show people’s decisions are heavily influenced by their environment, others’ behaviors, and how information is framed. Miss those nuances, and you’re optimizing for a utopian version of users, not the real, biased, context-driven humans they are.
That’s where behavioral frameworks like Roger Dooley’s Persuasion Slide and the Fogg Behavior Model prove so powerful.
As Line-Ariel shares, “They encourage designers to consider people’s motivations and the contextual barriers that prevent goal achievement.” Think of them as optimizer superpower lenses to see what’s truly driving users.
Because here’s the thing: people inevitably choose the path of least resistance.
Line-Ariel encourages considering “the different types of frictions – emotional, physical, or cognitive – that can impede or facilitate progress.” Even tiny frictions can be disproportionately demotivating.
But behavioral science doesn’t just diagnose problems – it also offers smart motivational boosts.
As Line-Ariel asserts, “Feedback loops leveraging confirmation bias – like celebrating milestones – can reinforce positive behaviors and increase satisfaction.” It’s psychological jujitsu to nudge users in the right direction gently.
So while A/B tests have their place, smart optimizers know to pair them with the behavioral insights that provide that essential wider lens into why users really do what they do.
Key Concepts to Understand Before You Approach Optimization Without A/B Testing
Before exploring these concepts, you need to check two things off your list:
- Overcome confirmation bias
- Embrace the null hypothesis mindset
Teresa Torres, a product discovery coach, argues that simply setting out to “validate ideas”
or “validate assumptions” opens the door to confirmation bias — our tendency to latch onto information that reaffirms our existing beliefs while disregarding contradictory data. As she states:
If we go into it assuming we are right and looking to confirm our own beliefs, that’s exactly what we’ll find, even when we’re 100% wrong. This is how confirmation bias works. We see the evidence that suggests we’re right, and we miss the evidence that suggests we’re wrong.
To combat this, she recommends adopting a mindset of genuine curiosity and openness in testing. Rather than setting out to confirm our ideas, we should design tests to uncover the truth about user behavior and preferences, even if it contradicts our assumptions.
This approach draws inspiration from the scientific method, which evolved to rigorously test hypotheses and overcome human bias toward confirming predetermined notions.
And as you’ll see below, optimization in digital marketing and product development often borrows from scientific methodologies, including A/B testing, widely used in clinical trials and other research fields. These methodologies help ensure decisions are based on robust evidence, leading to more effective and reliable outcomes.
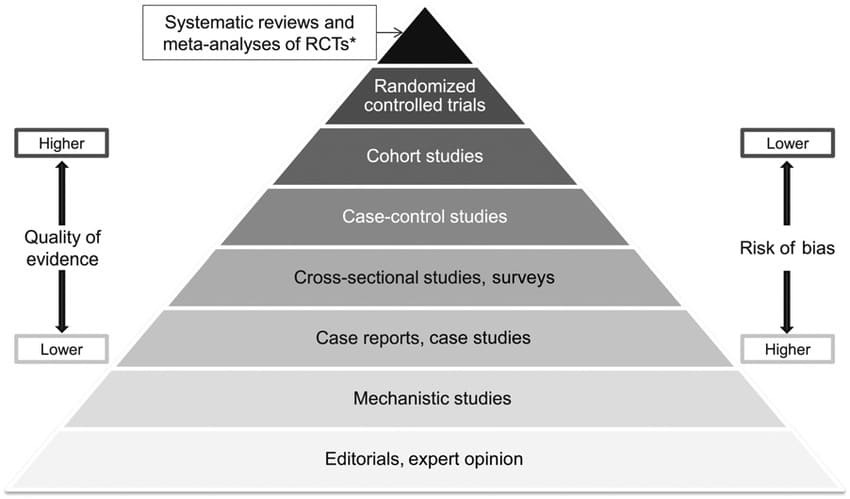
The Hierarchy of Evidence Pyramid is a tool that ranks the strength of research evidence, guiding practitioners in making informed decisions. The pyramid includes:
- Systematic Reviews: Top-level evidence that synthesizes data from multiple studies to provide comprehensive conclusions.
- Randomized Controlled Trials (RCTs): High-quality experimental studies where participants are randomly assigned to groups, minimizing bias. Note: In business and other applied fields, A/B testing is a simplified application of RCT principles.
- Cohort Studies: Observational studies that follow groups of people over time to assess the outcomes of different exposures.
- Case-Control Studies: Studies that compare individuals with a specific condition (cases) to those without (controls) to identify risk factors.
- Case Series, Case Reports: Detailed reports on individual or small groups of cases, providing insights into unusual or novel occurrences.
- Editorials, Expert Opinion: Opinions and interpretations from experts, considered the lowest level of evidence due to potential bias.
Experimentation practitioners use this hierarchy to design and evaluate experiments. When A/B testing isn’t feasible, they rely on:
- Systematic Reviews and Meta-Analyses: To aggregate existing data for informed decisions.
- Cohort and Case-Control Studies: To observe real-world scenarios and identify trends.
- Case Studies and Expert Opinions: For preliminary insights and hypothesis generation.
- Iterative Testing and Feedback: Using qualitative data and user feedback to refine approaches.
Ton Wesseling, a specialist in conversion optimization and digital experimentation who introduced the hierarchy of evidence pyramid to CRO, has since pointed out discrepancies in its application. Recognizing that optimizers often use the pyramid sub-optimally, he suggested a new visual:

Hierarchy of Evidence Pyramid (Ton’s Version)
Nearly 5 years ago, the team at Online Dialogue created an alternative that focuses on the risk associated with each research method rather than the perceived quality or bias.
They removed the opinions layer and positioned user research as the foundational pillar, serving as input for the experimentation engine. This approach acknowledges user research’s importance in guiding experimentation efforts while recognizing its limitations as a standalone evidence source.
Annemarie Klaassen, Lead Experimentation in the CRO Center of Excellence at VodafoneZiggo, suggests a different way to visualize the hierarchy of evidence—
Using a staircase:
Each step represents a different research method and A/B testing at the top aka some steps can be skipped if the evidence is strong enough.
Fidelity
The Hierarchy of Evidence is a great starting point for evaluating research methods, but it’s only part of the picture. To understand how our optimization efforts will work in the real world, we need to think about fidelity.
When we focus on fidelity, we bridge the gap between theory and practice. By using high-fidelity methods, we can trust that the improvements we see in experiments will hold true in the real world, leading to more reliable outcomes and buy-in.
Proposing a Fidelity Pyramid ft. Marcella Sullivan
Increased fidelity (mirroring of the real world) means certain strategies will be higher up the pyramid. The pyramid’s categorization is based on the level of fidelity to real-world user experience. This does not imply one method is ‘better’ than another but rather indicates the distance from the real user.
In scientific research, fidelity is the accuracy with which a study or experiment replicates what it aims to represent or understand. High fidelity means the research methods, conditions, and procedures closely mirror the scenario being studied, making the findings relevant and applicable to real-life situations.
We consider four types of fidelity:
- Internal Fidelity
- Related to how the researcher designs the study.
- High internal fidelity focuses on controlling variables to ensure that observed effects can be confidently attributed to the manipulation of the independent variable rather than extraneous factors.
- Experimentation and Internal Fidelity: In experimentation, we design tests to avoid noise in the results, similar to achieving scientific fidelity by exploring causation at the initial stage of designing experiments.
- External Fidelity
- Examines the extent to which the results of a study can be generalized beyond the specific conditions, populations, or contexts in which the research was carried out.
- High external fidelity means the findings apply to a wide range of settings, groups, or situations, enhancing the study’s relevance to real-world applications.
- Experimentation and External Fidelity: We ensure changes with high external fidelity are implemented site-wide, such as consistent navigation changes, device testing based on analytics, and accounting for seasonal changes or marketing impacts.
- Ecological Fidelity
- Ensures the research setting and conditions reflect the natural environment where the scenario under investigation typically occurs.
- High ecological fidelity means the study’s environment, procedures, and interactions are as close as possible to the real world.
- Experimentation and Ecological Fidelity: While usability testing may not replicate real scenarios perfectly, it still provides valuable insights. We also consider traffic sources, user intentions, and psychological factors, tying metrics like LCP, FID, and CLS to real-world user scenarios.
● Largest Contentful Paint (LCP): Measures the time it takes for the largest visible content element (like an image or block of text) to load and become visible within the viewport.
● First Input Delay (FID): Measures the time from when a user first interacts with a page (e.g., clicks a link, taps a button) to the time when the browser begins processing that interaction.
● Cumulative Layout Shift (CLS): Measures the sum total of all individual layout shift scores for unexpected layout shifts that occur during the entire lifespan of the page.
- Temporal Fidelity
- Related to the timing and duration of the research, ensuring these aspects reflect real-world conditions.
- Scientific studies should anticipate a realistic time frame in which changes might be expected to occur.
- Experimentation and Temporal Fidelity: It is crucial to ensure experiments run for a sufficient duration to capture the full range of user behaviors. Temporal fidelity can also involve segmenting experiments to understand how timing affects user interaction and conversion and ensuring test learnings are implemented promptly to maintain relevance.
Ladder of Causality
Understanding and applying causality helps achieve high fidelity in research, since it ensures that studies accurately replicate real-world scenarios and establish true cause-and-effect relationships2.
A note on causality and correlation:
Consider the famous example of the correlation between chocolate consumption and Nobel Prize winners. The correlation coefficient is high, suggesting a relationship. But this does not mean that eating more chocolate will lead to winning a Nobel Prize. The observed relationship is influenced by other factors, such as GDP per capita, which confounds the interpretation.
For more examples (and some truly hilarious ones), check out Tyler Vigen’s resource on spurious correlations.
To better understand causal relationships, we can use the ladder of causality, which Ryo Tanaka drew from Judea Pearl’s “The Book of Why: The New Science of Cause and Effect.”
The ladder has three levels:
- Association – Seeing/Observing:
- The first level involves making observations and identifying patterns. For example, observing that customers who buy toothpaste also frequently buy dental floss. This is described by the conditional probability P(Dental floss | Toothpaste).
- However, this level does not explain why the observed relationship exists.
- Intervention – Doing:
- The second level involves manipulating a variable to see its effect. For instance, doubling the price of toothpaste to observe changes in dental floss sales. This is symbolized by the intervention operator “do,” and helps establish a cause-and-effect relationship.
- Unlike mere observation, this level provides evidence of causality by controlling for other factors.
- Counterfactuals – Imagining:
- The third level involves considering hypothetical scenarios that didn’t occur. In CRO, this might involve asking, “What would our conversion rate have been if we hadn’t implemented the new checkout process?”
- It requires a deep understanding of causal relationships, going beyond observed data to grasp the underlying mechanisms of how changes affect outcomes.
- Causal models help answer these questions by structurally describing relationships between events, even those not directly observed.
So, Should You A/B Test That?
From causality’s ‘why’ to testing’s ‘when’—enter John Ostrowski’s framework, a quick guide to smarter optimization beyond just A/B tests.
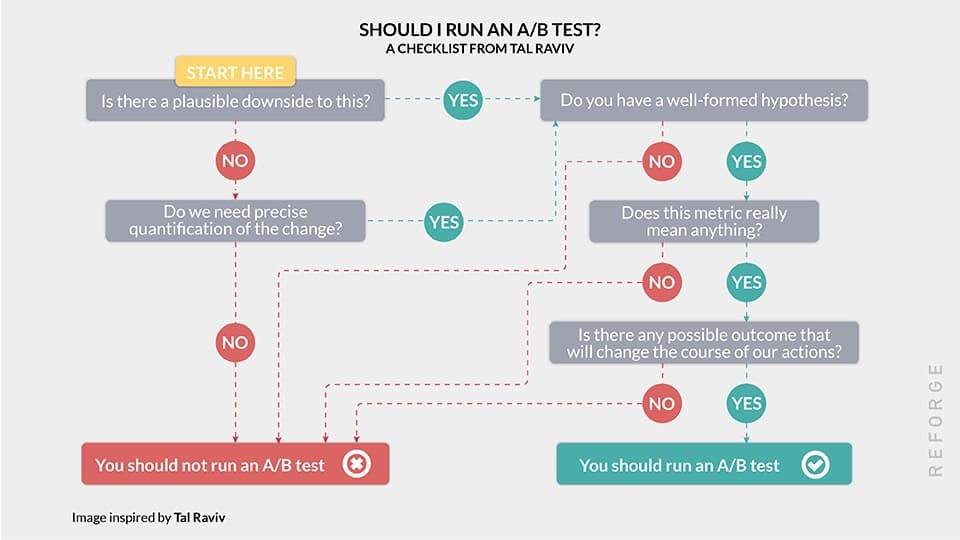
John Ostrowski, Director of Product & Experimentation at Wise Publishing shared this “Should you A/B test framework” with us.
And as you can see, oftentimes, even when you have the traffic, you probably should not “test that.”
Sidenote: A/B testing is a powerful tool, but it’s crucial to know when it’s worth using. John provides a practical model to help product teams decide whether to run an A/B test:
- Evaluate the Plausible Downside: Start by considering if there is a plausible downside to the change. If there’s uncertainty about whether the change could decrease conversions, it might be worth testing.
- Hypothesis Formation: Make sure you have a well-formed hypothesis. This involves conducting research and understanding the potential impact of the change.
- Assess the Impact: Consider whether the change is significant enough given the page’s traffic levels. Minor changes might not justify the testing resources.
- Experiment Scope: Determine if it is worth enlarging the experiment. Sometimes, merging tests or expanding the scope can make the test more valuable.
John’s approach is rooted in critical thinking and a deep understanding of users. A/B testing should not be seen as a one-size-fits-all solution but rather as a strategic tool used in the right context.
A/B testing is not a substitute for critical thinking or a deep understanding of your users. Suggesting A/B tests inappropriately can be a way to sound smart in a meeting at best, and at worst, it can lead to cargo cult science.
John Ostrowski
Quick Review of Validation Methods
Note from Marcella Sullivan: Building upon the foundation laid by Itamar Gilad (Author of Evidence-Guided, Product coach, Ex-Google PM) and Craig Sullivan‘s initial work, I’ve curated an expanded and modernized collection of validation methods.
Disclaimer: This isn’t an exhaustive list of idea validation methods.
| Method | What is it? | Most useful for: |
Downsides: | ||||||||||||||||||||
|---|---|---|---|---|---|---|---|---|---|---|---|---|---|---|---|---|---|---|---|---|---|---|---|
| Analytics Event Data | Collecting data on user interactions with specific elements of a website or app, focusing on interaction tracking to understand user behavior. | Understanding the “Where” and the “How big” of user interactions through quantitative analysis. Identifying which features, functions, and links people use most. | Requires considerable technical expertise, especially for complex interactions. Data needs to be analyzed and turned into reports and dashboards to be useful. | ||||||||||||||||||||
| Site-Based Polls or Surveys | Short questions or surveys on a website or app to get feedback from visitors. | A low-cost, simple feedback method on specific areas, features, or pages. | Potential for response bias as users with strong opinions may be more likely to respond. Intrusive surveys can disrupt user experience and lead to low response rates. | ||||||||||||||||||||
| Intercept Surveys | Surveys triggered by user actions, such as attempting to leave the site or reaching a specific engagement level. | Inquiring about specific interactions or stages within a user journey, asking timely questions based on user actions. | Can result in hurried or less thoughtful responses. Overuse can lead to survey fatigue. Requires careful planning to avoid disrupting critical user tasks. | ||||||||||||||||||||
| Email Surveys | Sending surveys via email to get regular feedback from customers. | Collecting both qualitative and quantitative feedback over time, useful for comparing service and customer satisfaction metrics. | Limited to users who have given permission to be emailed. Poorly designed surveys or bad subject lines can lower response rates. May require incentives to achieve sample sizes. | ||||||||||||||||||||
| Open-Ended Feedback | Polls, surveys, onsite feedback, questions, and comments allowing users to share their thoughts in their own words. | Discovering new insights, problems, or issues by listening to how users describe them. | Historically required increased analysis time, though AI and commercial tools have expedited the process. | ||||||||||||||||||||
| Session Replay | Recordings of user sessions showing interactions with a product or interface. | Identifying friction points, user struggles, bugs, and UX flaws. | Some tools can be expensive. Requires set-up and integration effort. Can be time-consuming to find useful recordings and analyze them. | ||||||||||||||||||||
| User Interviews | One-on-one interviews with users, prospective users, or stakeholders to discuss topics or research areas in depth. | Gaining deeper insights into user problems, needs, preferences, and experiences. | Costs associated with recruiting, interviewing, and summarizing outputs. Requires a skilled interviewer or UX researcher. | ||||||||||||||||||||
| Lab Usability Testing | Participants are invited to a lab and given scenarios and tasks to perform with a product. | Evaluating users’ ability to complete tasks through interactions with a product. | More expensive than remote testing. Uses lab devices rather than users’ own setups. Requires multiple staff to run. | ||||||||||||||||||||
| Remote Moderated Testing | Participants use videoconferencing to share their screen and camera while performing tasks. | Similar to lab testing but with location flexibility and use of participants’ own devices. | Requires a moderator. Less close observation compared to lab testing. | ||||||||||||||||||||
| Unmoderated Remote Testing | Participants perform tasks guided by software, with feedback collected for later analysis. | Evaluating more participants without moderation. | No moderator to ask follow-up questions. Requires skilled scenario design. | ||||||||||||||||||||
| Prototype Testing | Testing a concept or prototype to get feedback before building. | Identifying defects in a concept or prototype before coding. | Fidelity levels vary, affecting the range and depth of feedback. | ||||||||||||||||||||
| Device & Viewport Testing | Checking how a website or app works on different devices and screens. | Ensuring a good experience across all devices and identifying UX issues at different breakpoints. | Requires knowledge of which devices customers use. Companies need to purchase the relevant devices. | ||||||||||||||||||||
| Accessibility, Text, Contrast | Ensuring that design is accessible to all users, considering economic and legal implications. | Avoiding constraints due to inaccessible content or design. | Requires effort to build accessibility into the product from the start. Risk of legal issues if accessibility is not addressed. | ||||||||||||||||||||
| Card Sorting | Participants organize items into piles and name them, analyzed by software. | Building or improving a taxonomy to match user mental models. | Recruitment costs, though it can be done online. | ||||||||||||||||||||
| Tree Testing | Testing the Information Architecture to determine findability. | Testing navigation prototypes, benchmarking taxonomy, and evaluating existing taxonomy for improvements. | Recruitment costs, though it can be done online. |

The spectrum of user research methods offers a range of techniques for validating ideas and making informed decisions when A/B testing is not feasible.
These methods span from highly observational approaches, such as diary studies and usability testing, to quantitative methods like analytics and event tracking. In between, there are methods that blend observation and opinion, such as card sorting, participatory design, and user interviews.
Prioritize methods that lean towards the observational end of the spectrum to gather more objective evidence for design decisions. Also consider attitudinal research as it can provide valuable insights that observation alone may miss.
Steps for Method Selection and Validation
1. Identify the Objective: Clearly define what you aim to achieve with your optimization.
2. Understand Causality: Assess the potential cause-and-effect relationships. This step ensures that the changes you observe can be attributed to the actions you take.
3. Choose a Method: Select an optimization method that aligns with your objective. This could be multivariate testing, cohort analysis, or user journey analysis, among others.
4. Implement with Fidelity: Ensure the method is applied accurately and consistently across your tests. This maintains the integrity of your data.
5. Validate the Results: At each stage, validate your findings. Use statistical methods, peer reviews, or replication of results to confirm your conclusions.
Bringing Together Different Types of Insights For Learning & Growth
The key is to layer different quantitative and qualitative data sources to build a comprehensive understanding of user behavior and the underlying issues. This allows you to identify high-impact areas to optimize.
Simon Girardin, CRO Manager at Conversion Advocates shared exactly how testers can achieve this in a recent masterclass:
- Gather data from multiple perspectives:
- Quantitative: Google Analytics, heatmaps, session recordings, sales data etc.
- Qualitative: User surveys, interviews, usability tests, customer support logs etc.
- Analyze the data looking for patterns, anomalies, and insights across sources:
- Use quantitative data to identify pages/flows with high drop-offs, friction etc.
- Use qualitative data to understand the “why” behind user struggles
- Look for areas where quant and qual data converge on the same issues
- Formulate a “problem statement” summarizing the user pain point uncovered
- E.g. “Mobile users struggle to find pricing info, leading to high drop-off on PDP”
- Prioritize problems based on estimated business impact using metrics like:
- Number of users affected
- Revenue/lead impact if solved
- Alignment with current company goals/metrics
- For high-priority items, devise potential solutions drawing from:
- Qualitative user feedback on pain points
- Quantitative signals on where users struggle
- Best practice recommendations
- Create a design, copy or UX change to deploy the proposed solution
- Roll out the change to all users (no A/B test) and monitor:
- Funnel metrics like bounce rate, conv. rate etc.
- Engagement metrics like time on page, % scrolled etc.
- Quantitative feedback like survey scores, rage clicks etc.
- Qualitative feedback from tools, support logs etc.
- If metrics improve, the change is validated – leave it rolled out. If not, revert the change and return to evaluating other solutions
Ross Williams, Freelance Design Research Lead, shared this caveat on LinkedIn:

Psst..Catch the event’s replay here or read this piece on how to layer qual, quant, and heatmaps to build better hypotheses.
Resource: You might also enjoy the book, The Lean Startup by Eric Ries that talks about rapid experimentation through the Build-Measure-Learn cycle to create an MVP. Eric Ries recommends validating ideas with real customers and being data-driven to either stay the course or pivot.
- Meta-analysis is reliable only when it is industry and site area/function specific. ↩︎
- By acknowledging the important role of exploring causation, we can establish that the ideal position for this is at the initial stage of designing experiments (just how it’s done to achieve scientific fidelity) ↩︎

Written By
Sneh Ratna Choudhary, Marcella Sullivan


Edited By
Carmen Apostu
