30 A/B Testing & CRO Stats Every Optimizer Should Know in 2026 (With Original Convert Data)
If you’re running A/B tests in 2026, you’re part of a pretty exclusive club. Less than 0.2% of all websites even experiment at all.
But among the sites that do test, the gap between going through the motions and compounding results is massive.
We pulled together 30 stats on CRO and experimentation, including original data from experiments run on Convert in 2025, to show you where the industry stands right now, what separates high-performing programs from everyone else, and where the biggest opportunities are hiding.
A/B Testing Adoption & Industry Stats
Around 0.2% of the total websites online are using A/B testing tools or running tests. (Builtwith)
BuiltWith’s technology tracking shows that roughly 2.2 million websites currently use A/B testing or experimentation platforms (across tools like Google Optimize legacy installs, Convert, Optimizely, VWO, AB Tasty, etc.). With an estimated 1.1–1.2 billion active websites globally, this means around 0.2% of websites are running structured experiments.
However, adoption increases among high-traffic sites.
Of the top 10,000 largest sites by traffic, 32% use an A/B testing or personalization platform. Adoption drops significantly outside this top tier: only 20.95% of the Top 100,000 sites and about 11.5% of the Top 1 Million websites run A/B testing tools. (Builtwith)
In reality, there is probably a much higher number of them testing, but BuiltWith only detects client-side technologies, so large companies running server-side or custom experimentation platforms may not be counted.
It’s clear to see that sites with a lower traffic volume are focusing less on CRO. As traffic increases, experimentation adoption rises sharply.
Among experimentation practitioners surveyed by Speero, the largest concentrations come from Retail & Ecommerce (27%), Technology/SaaS (23%), and Finance & Insurance (13%). (Speero, Experimentation Maturity Program Report, 2025)
Why is this?
These particular industries are usually very conversion-focused. They live and die by metrics like AOV, LTV, MRR, and churn rate. Rather than having to convince their boss to run tests, testing and data analysis are embraced at all levels.
These companies will often run more tests more often, get more results, improve their conversions and pull ahead of their competitors.
A/B Testing Maturity Stats
We’ve already seen that most companies are not even experimenting.
But there’s a big difference between those who are just starting to run tests and those who have baked testing into their company culture.
The companies that are heavily focused on CRO and ‘maturing’ their experimentation programs are usually the market leaders, as you’ll see from the results in just a second.
But before that, shout-out to the team at Speero for their fantastic work on their new Maturity Program reports. Several of the stats below come from their latest findings, and I highly recommend that you read the full thing.
In 2025, 54% of companies sit at strategic or transformative levels – up from 35% in 2021 since Speero started tracking this. The progressive middle has shrunk from 38% to 33%, while beginners are down from 9% to 2%. (Speero, Experimentation Maturity Program Report, 2025)
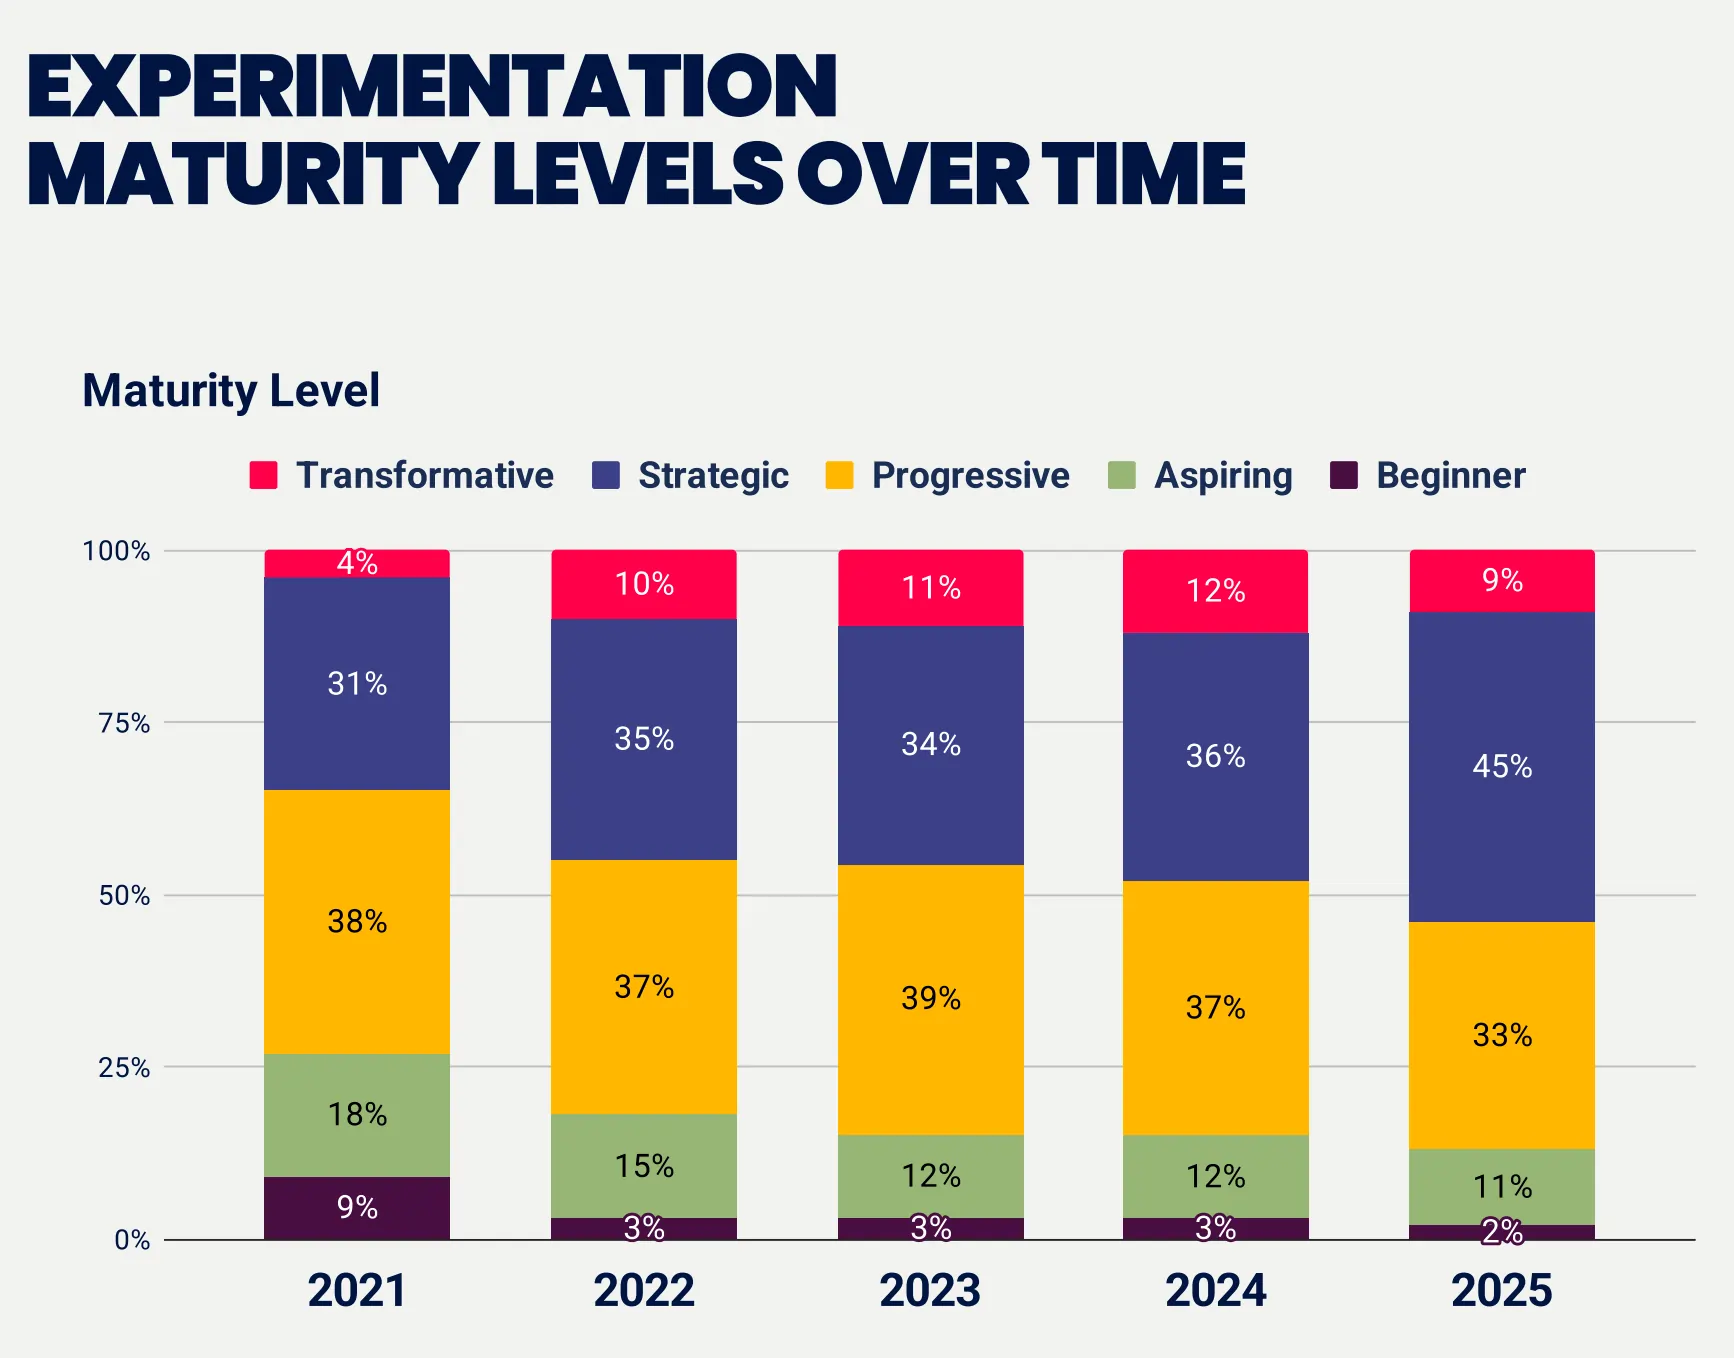
The industry is maturing. Four years ago, over a quarter of companies were stuck at beginner or aspiring levels. Now that’s just 13%. Companies are figuring out the fundamentals – tools, processes, dedicated staff.
What they’re not doing is making the leap to transformative. Only 1 in 10 companies reach transformative, meaning they’ve figured out executive sponsorship, cross-team collaboration, sharing learnings, and building a culture of experimentation.
33% of companies at the beginner maturity level have been A/B testing for a year or less, while 67% don’t even know how long they’ve been testing, suggesting experimentation hasn’t been formalized or tracked. (Speero, Experimentation Maturity Program Report, 2025)
The reality is that companies that are less ‘conversion focused’ tend to start CRO, but never really evolve their process. Usually, someone on the team takes on the additional responsibility and runs a few tests, but struggles to get buy-in from management to dive deeper or add further funds.
This creates a bottleneck in tests performed and results achieved. Which means management never sees enough ROI to justify more investment. So the program stays stuck, or worse, decisions get made on gut feelings instead.
Experimentation Types, Tools & Velocity Stats
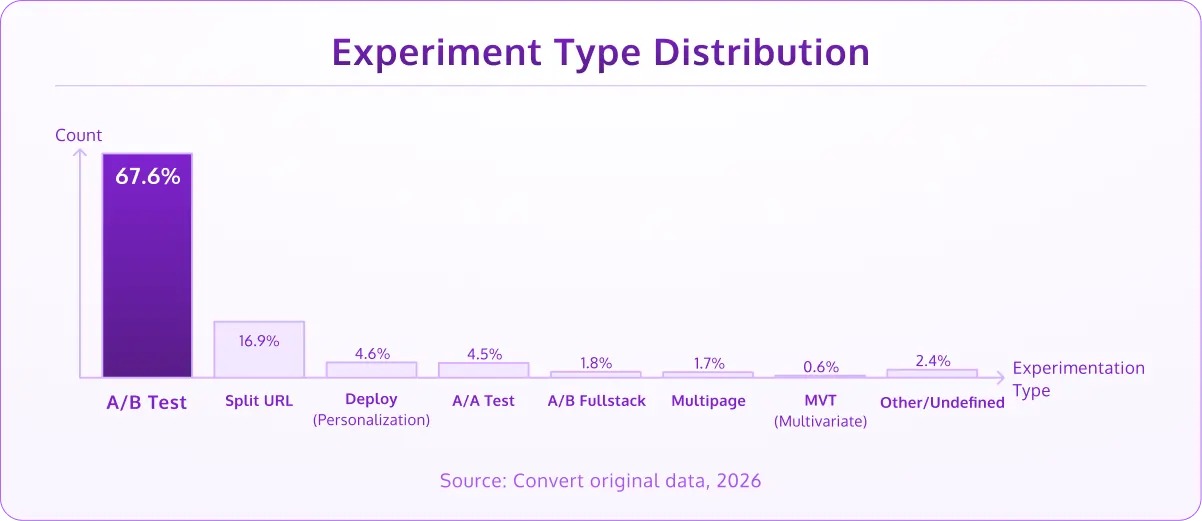
A/B tests account for 67.6% of all experiments, followed by split URL tests at 16.9%. Multivariate testing sits below 1%. (Convert original data, 2026)
A/B testing remains the go-to. It’s straightforward, it works, and it doesn’t need massive traffic to get a result.
Split URL testing has carved out a healthy second place, which makes sense for teams testing larger structural changes, such as entirely different page layouts or flows.
Personalization accounts for 4.6% of all experiments, but the teams that do personalize are doing it consistently. It’s a natural next step once you’ve built up a library of winning test insights.
MVT remains niche, likely because the traffic requirements for a meaningful multivariate test are out of reach for most teams.
Fewer than 3% of experiments use multi-armed bandit algorithms. Traditional fixed-horizon A/B testing still dominates overwhelmingly. (Convert original data, 2026)
MAB works well in specific scenarios, such as short-lived promotions, limited traffic windows, or when you want to minimize opportunity cost during a test.
For most teams, though, the classic A/B framework remains the workhorse. This likely comes down to familiarity and the fact that most conversion rate optimization education is built around frequentist testing.
Google Analytics is the most common integration among CRO practitioners, with GA4 alone used by over half of teams. Nearly 1 in 5 integrate heatmap tools alongside their experiments. (Convert original data, 2026)
GA is table stakes at this point, but that 1 in 5 integrating heatmaps is where teams start to separate themselves.
Pairing your test results with behavioral data from heatmaps and session recordings gives you the “why” behind the “what.”
Convert’s most active accounts run over 1,000 experiments per year. (Convert original data, 2026)
That’s not a typo. These teams have baked testing into everything they do. They have prioritized backlogs, clear ownership, and a strong culture where testing is how decisions get made.
Statistical Rigor & Test Quality Stats
A/A tests make up 4.5% of all experiments. (Convert original data, 2026)
An A/A test is run to make sure that:
- Your current results are accurate, and
- Your testing tool is giving you correct results.
The most mature programs will have run an A/A test when starting out and possibly again during the year, just to keep a check that everything is working correctly.
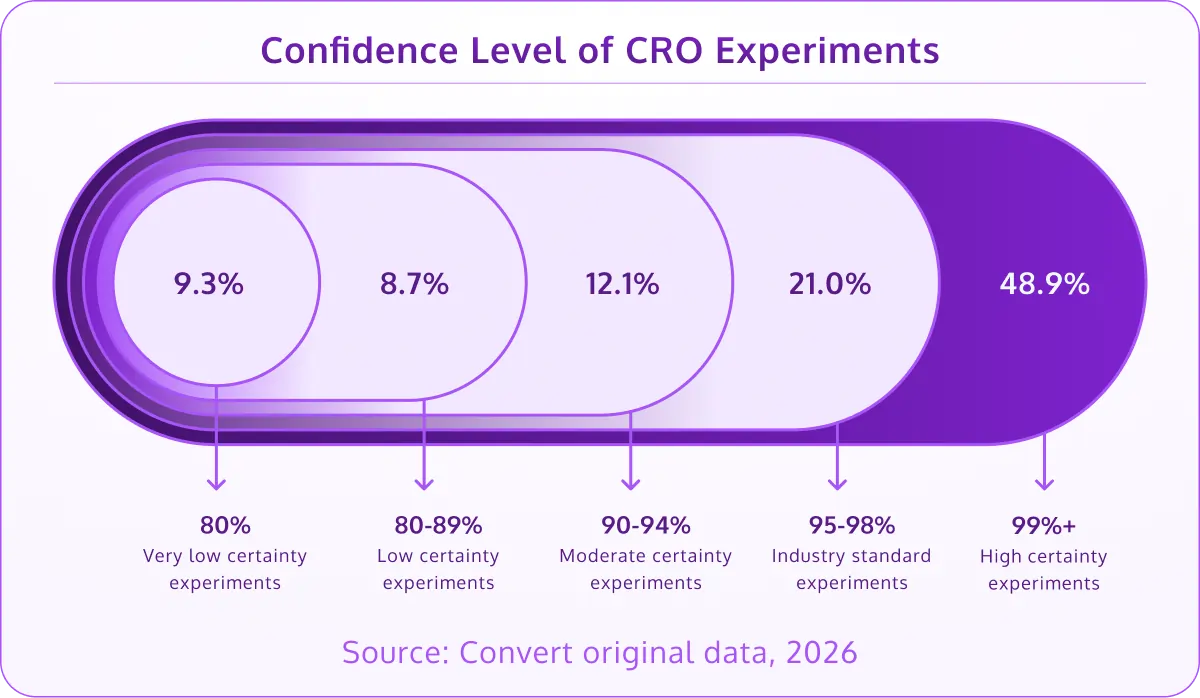
70% of CRO teams run their experiments to 95%+ statistical confidence, with nearly half reaching 99%+. (Convert original data, 2026)
Across experiments run on Convert in 2025, 70% met the industry-standard 95% confidence level, and 49% reached 99%+. That’s a sign of a maturing industry, with teams using Convert letting their tests run long enough to trust the results.
Here’s how the full confidence distribution breaks down:
- Below 80%: 9.3% of tests
- 80–89%: 8.7%
- 90–94%: 12.1%
- 95–98% (industry standard): 21%
- 99%+ (high certainty): 48.9%
About 18% of tests still finish below 90% confidence. That doesn’t necessarily mean those tests were wasted. Sometimes a directional result is all you need to inform your next hypothesis. But if you’re making big implementation decisions, you want to be in that 95%+ zone.
60% of completed A/B tests deliver under 20% lift, and 84% come in under 50%. (Convert original data, 2026)
Here’s the full lift distribution across all completed tests:
- Under 10%: 39.8%
- 10–19%: 20.4%
- 20–29%: 9.7%
- 30–49%: 14.3%
- 50–99%: 8%
- 100%+: 7.8%
The 40% of tests moving the needle by single digits or low double digits is completely normal. CRO is a compounding game where the gains stack. The teams that understand this tend to be the ones that stick with testing long-term.
Then there’s the tail end: about 16% of tests show 50%+ lift, which is where you want to pause and validate before shipping. (More on that below.)
About 1 in 10 experiments run with fewer than 1,000 visitors, while the most common sample size range is 10K–50K visitors per test (37% of all experiments). Only about 9% reach enterprise-scale traffic of 100K+. (Convert original data, 2026)
Under-powered tests remain one of the most common pitfalls in CRO. If you’re running a test with a few hundred visitors and calling a winner, you’re unlikely to get any meaningful results.
The sweet spot for most teams is 10K–50K visitors per test – enough traffic to get meaningful results without needing months of runtime.
7.8% of completed A/B tests show 100%+ improvement – a phenomenon known as Twyman’s Law, where results that look too good to be true usually are. (Convert original data, 2026)
About 1 in 13 tests lands in this suspicious zone. Some of them will be real wins: a redesigned checkout flow, a pricing change, a completely new page layout. But others will be data anomalies, segmentation issues, or novelty effects that fade over time. The smart move is always to rerun the test and check your segments before shipping anything to production.
52% of businesses don’t have a specific process to QA experiments before launching them. (Speero, Experimentation Maturity Program Report, 2025)
This is a rather concerning stat, but an easy one to fix. A simple pre-launch checklist prevents this entirely. The fact that half of all companies skip this step explains a lot about why so many programs struggle to prove ROI.
CRO Team & Culture Challenges Stats
Based on the last section, you can probably guess some of the key issues that testers are facing.
Some you might not have thought of before…
58% of companies don’t have a clear prioritization framework at all, and only 14% strongly agree they have a well-defined framework tailored to their needs. Even among transformative-level teams, only 57% strongly agree they have prioritization in place. (Speero, Experimentation Maturity Program Report, 2025)
Without a prioritization framework, teams waste time:
- Deciding which tests to run next off of random decisions and not testing the most important, high-impact thing first,
- Allocating resources inefficiently, and
- Doing the math in their head and not using a hypothesis generator.
The thing is, we all have biases. Without a framework like PXL, ICE, or PIE, we can waste time on low-impact tests rather than running tests that could yield the largest return.
Half of experimentation teams have a centralized knowledge base for storing test plans, results, and learnings. (Speero, Experimentation Maturity Program Report, 2025)
This separates mature programs from everyone else. Without a central place to store what you’ve tested and what you’ve learned, teams end up re-running tests that were already done, missing patterns across experiments, or losing institutional knowledge when someone leaves.
63% of companies say their culture encourages testing, but only 47% feel their experimentation efforts actually get recognized. That’s a 16-point gap between doing the work and getting credit for it. (Speero, Experimentation Maturity Program Report, 2025)
Invisible work doesn’t get resources, headcount, and it doesn’t influence product decisions. The teams closing this gap are the ones tying every result back to revenue impact. It’s clear that the most mature programs build a culture of sharing and experimentation.
Not only are they sharing their findings, but the market leaders are even democratising experimentation and giving other departments the freedom and tools to do so.
10% of companies have zero dedicated experimentation staff. Another 25% have exactly one person responsible for their entire testing program. (Speero, Experimentation Maturity Program Report, 2025)
This ties into what we’re seeing with regard to the ‘maturity’ of testing programs. You have companies testing now and again, some with a single full-time tester, some with experimentation teams, and others that have even taught each team how to test.
Only 26% of companies strongly agree they have a senior management sponsor accountable for experimentation growth and quality. (Speero, Experimentation Maturity Program Report, 2025)
Without someone in leadership fighting for your program, experimentation stays a side project. Tests get deprioritized, winning variations sit unimplemented, and budget requests go nowhere. Finding an executive sponsor matters more than tool selection or test velocity.
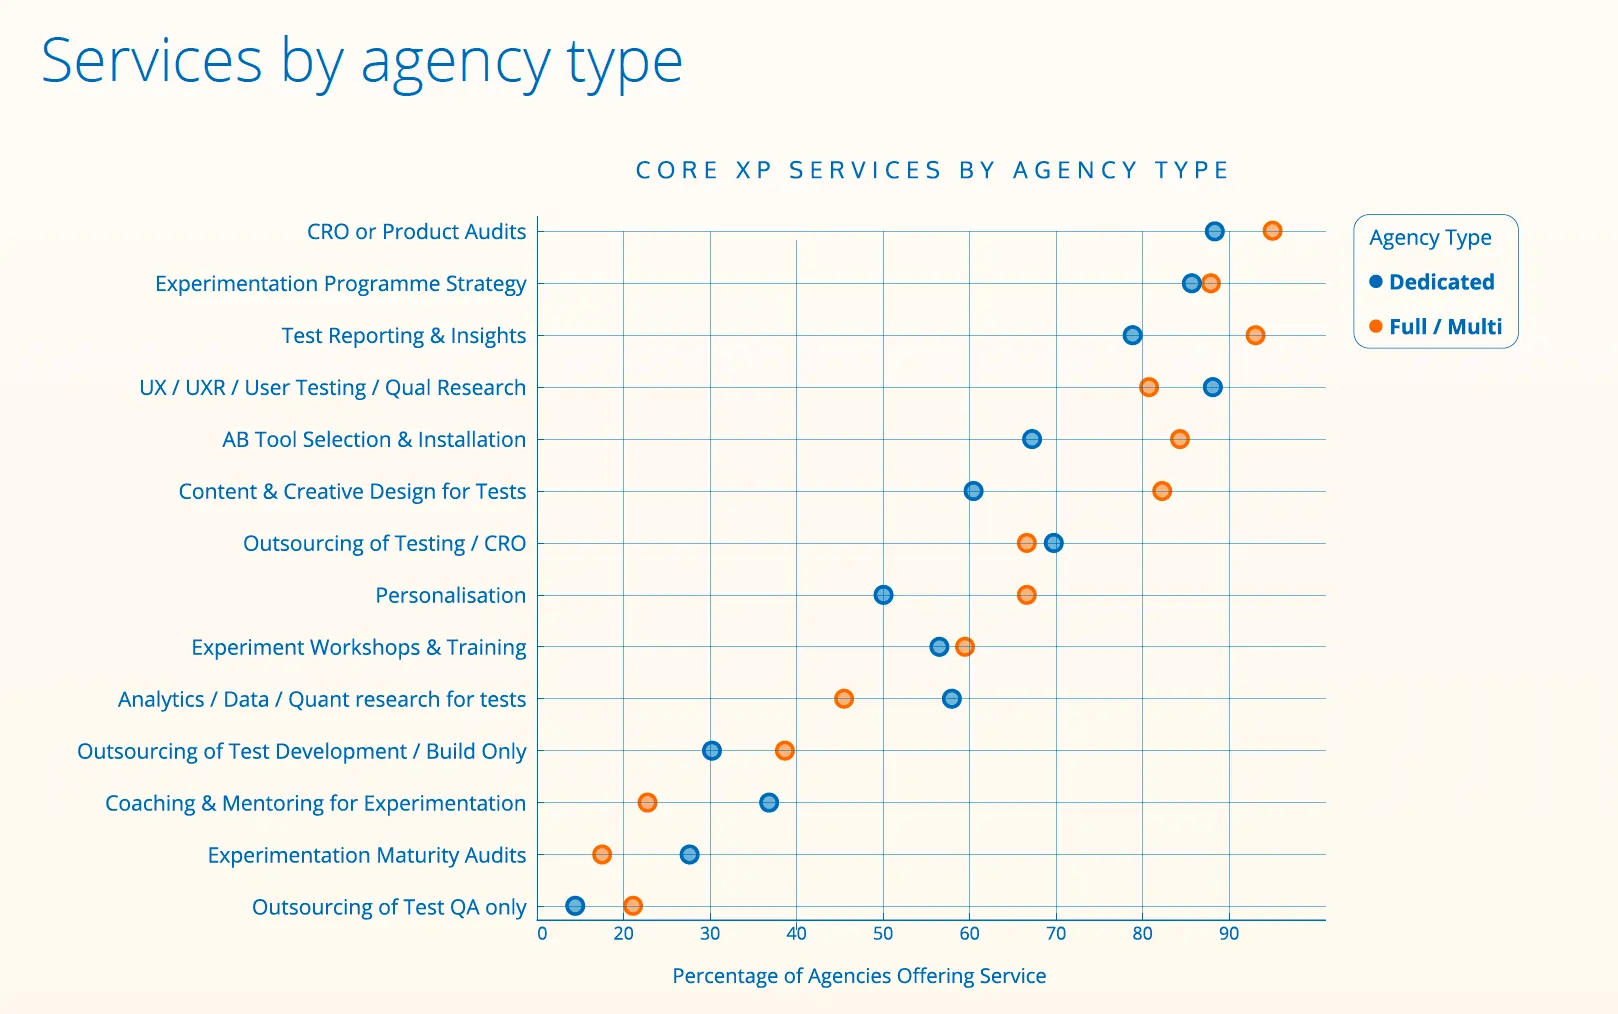
Experimentation Agency Ecosystem Stats
Out of 237 experimentation agencies identified worldwide, 55% are dedicated experimentation agencies, 43% are full or multi-service, and 2% specialize in dev & QA. (Convert Agency Report, 2025)
When Convert set out to build an agency directory, we expected to find 100–125 agencies. We found nearly double that, and the ecosystem is truly global and multilingual.
But most of these agencies are small: over half have teams of just 1–5 people, and only 7% have more than 30.
Small teams, but experienced ones: 90% have been at this for 5+ years, and 40% have more than a decade under their belt.
Nearly a third of agencies run 10 or fewer experiments per month, and about 60% manage just 2 or fewer tests per person per month. (Convert Agency Report, 2025)
That’s partly a capacity issue and partly a reflection of how much time goes into research, strategy, and client management alongside the testing itself.
76% of agencies say AI is now a key part of their experimentation workflow. (Convert Agency Report, 2025)
AI usage is highest among newer, less mature agencies (81% for small teams vs. 70% for mid/large).
The top use cases are research and analysis, hypothesis formation, coding experiment variants, and client reporting.
Most usage is still ad-hoc, bolted onto existing workflows rather than deeply integrated, but a few agencies have already built custom LLMs or are running agentic technology to automate parts of the experimentation process.
As AI continues to eat into the execution side, 70% of agencies say they’re shifting their focus from tactical testing to strategic experimentation, program design, enablement, and business-level outcomes.
60% of agencies say experimentation is shifting toward product teams, and away from marketing. (Convert Agency Report, 2025)
Agencies report that their primary stakeholders are increasingly Heads of Product. And that changes the scope of what gets tested, who’s involved, and what success looks like.
65% say clients are also bringing more experimentation in-house (rising to 87% among large agencies), which means the agencies that survive are the ones moving upstream: embedding with teams, designing experimentation programs, and proving business-level outcomes rather than just delivering test wins.
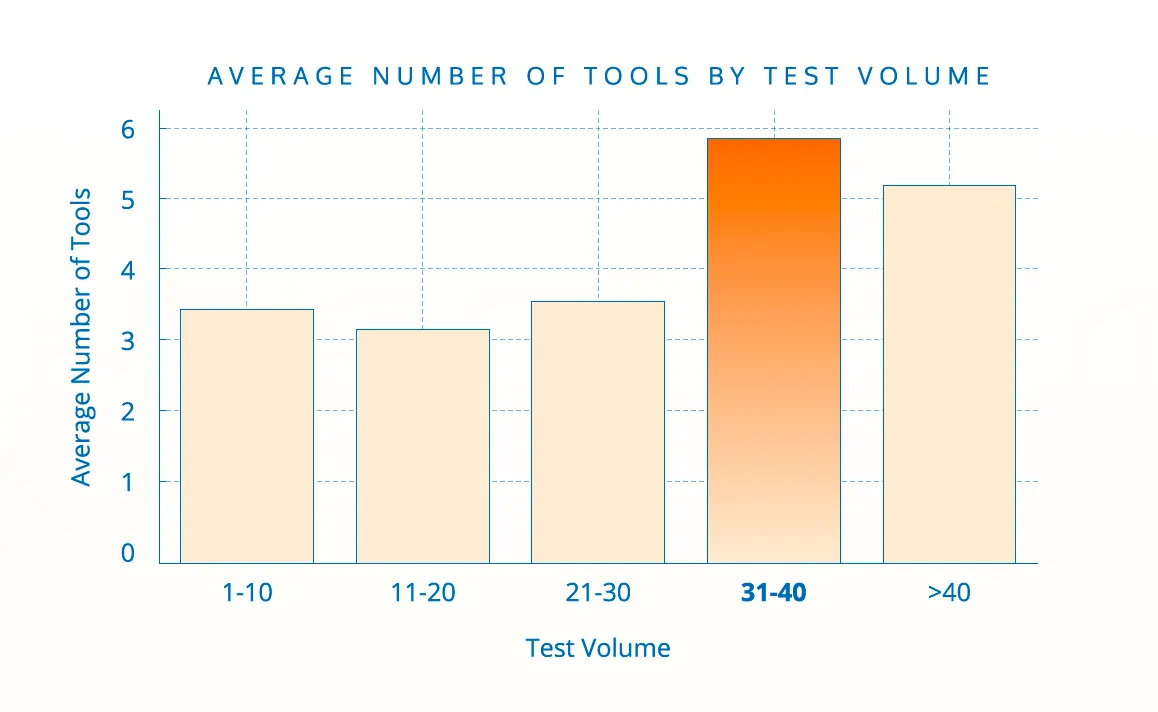
A legend-level agency (15+ years) is managing nearly 2x the number of testing tools compared to a starter agency (1-4 years). (Convert Agency Report, 2025)
Test volume is the real inflection point.
Below 30 tests/month, agencies stay lean. Above 31-40 tests/month, they jump to nearly 6 tools.
This reflects a maturity threshold: high-volume testing requires partnering with multiple specialized tools.
Conversion Rate Optimization & Personalization Stats
Companies that execute personalization effectively see outcomes like 5–15% revenue lift and 10–30% improvement in marketing ROI. (McKinsey)
71% of consumers expect personalized interactions, and 76% get frustrated when they don’t get them. It’s no wonder that personalization has seen such a focus in the past year.
When done well, personalization can deliver material business lift.
The median landing page conversion rate is ~6.6%. (Q4 2024 benchmark report, Unbounce)
Based on analysis of 41,000 landing pages and 464 million visits, Unbounce found the typical page converts at around 6.6%. Most gains come from tightening message match, clarifying the value proposition above the fold, and removing the tiny hesitation points that make visitors pause instead of act.
The average checkout still uses 11.3 form fields, even though most flows only need about 8. (Baymard Institute)
Baymard’s large-scale usability research shows that many ecommerce checkouts ask for more information than necessary, increasing cognitive load at the most sensitive moment in the funnel. Every additional field introduces a tiny moment of doubt. Enough of those moments, and users abandon.
Form reduction remains one of the highest-impact, lowest-risk CRO tactics. Autofill, address lookup, guest checkout, and progressive data collection often outperform any copy experiment.
User-Generated Content (UGC) can help increase conversion rate by 161%. (Yotpo)
Yotpo ran a study of 200,000 ecommerce stores and 163 million orders to see how UGC affected sales.
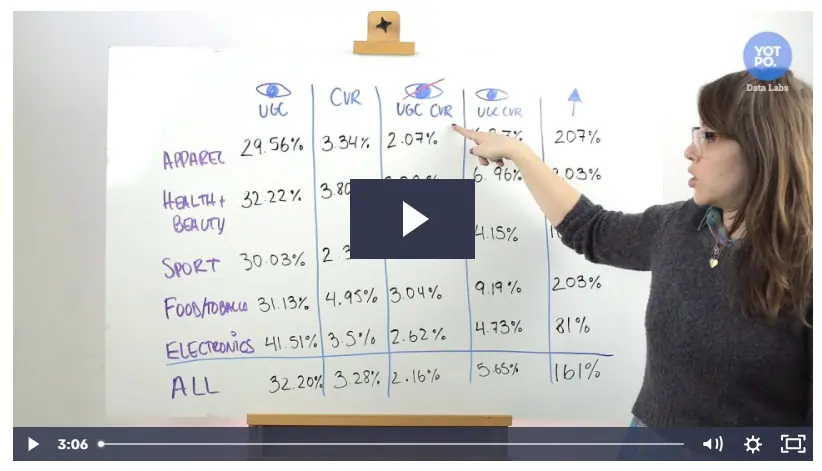
The study results varied by industry, but in every instance, it provided a lift.
Conclusion
So there you have it. The most interesting, important, and up-to-date stats that we could find on CRO and A/B testing.
The data paints a clear picture of where experimentation stands today.
Companies that test are getting more sophisticated: running to higher confidence levels, investing in data quality, and formalizing their processes.
At the same time, AI is changing how work gets done, experimentation is moving from marketing into product, and agencies are shifting from execution to strategic enablement.
The common thread across all of it is that programs that deliver results consistently are the ones with serious infrastructure behind them: prioritization frameworks, executive buy-in, dedicated CRO teams, and a culture of experimentation that acts on what the data says.

Written By
Daniel Daines Hutt

Edited By
Carmen Apostu
